Most industrial data analysis happens too late and too far away. A PLC signals an anomaly; the data travels to a cloud platform, gets processed, and an alert arrives — minutes or hours after the moment that mattered. Meanwhile, the line kept running.
Litmus Edge was built to close that gap. Its Analytics module turns the edge into a full DataOps execution environment: you define flows, apply logic, run AI models, and publish results — all locally, all in real time, without moving raw OT data off the plant floor.
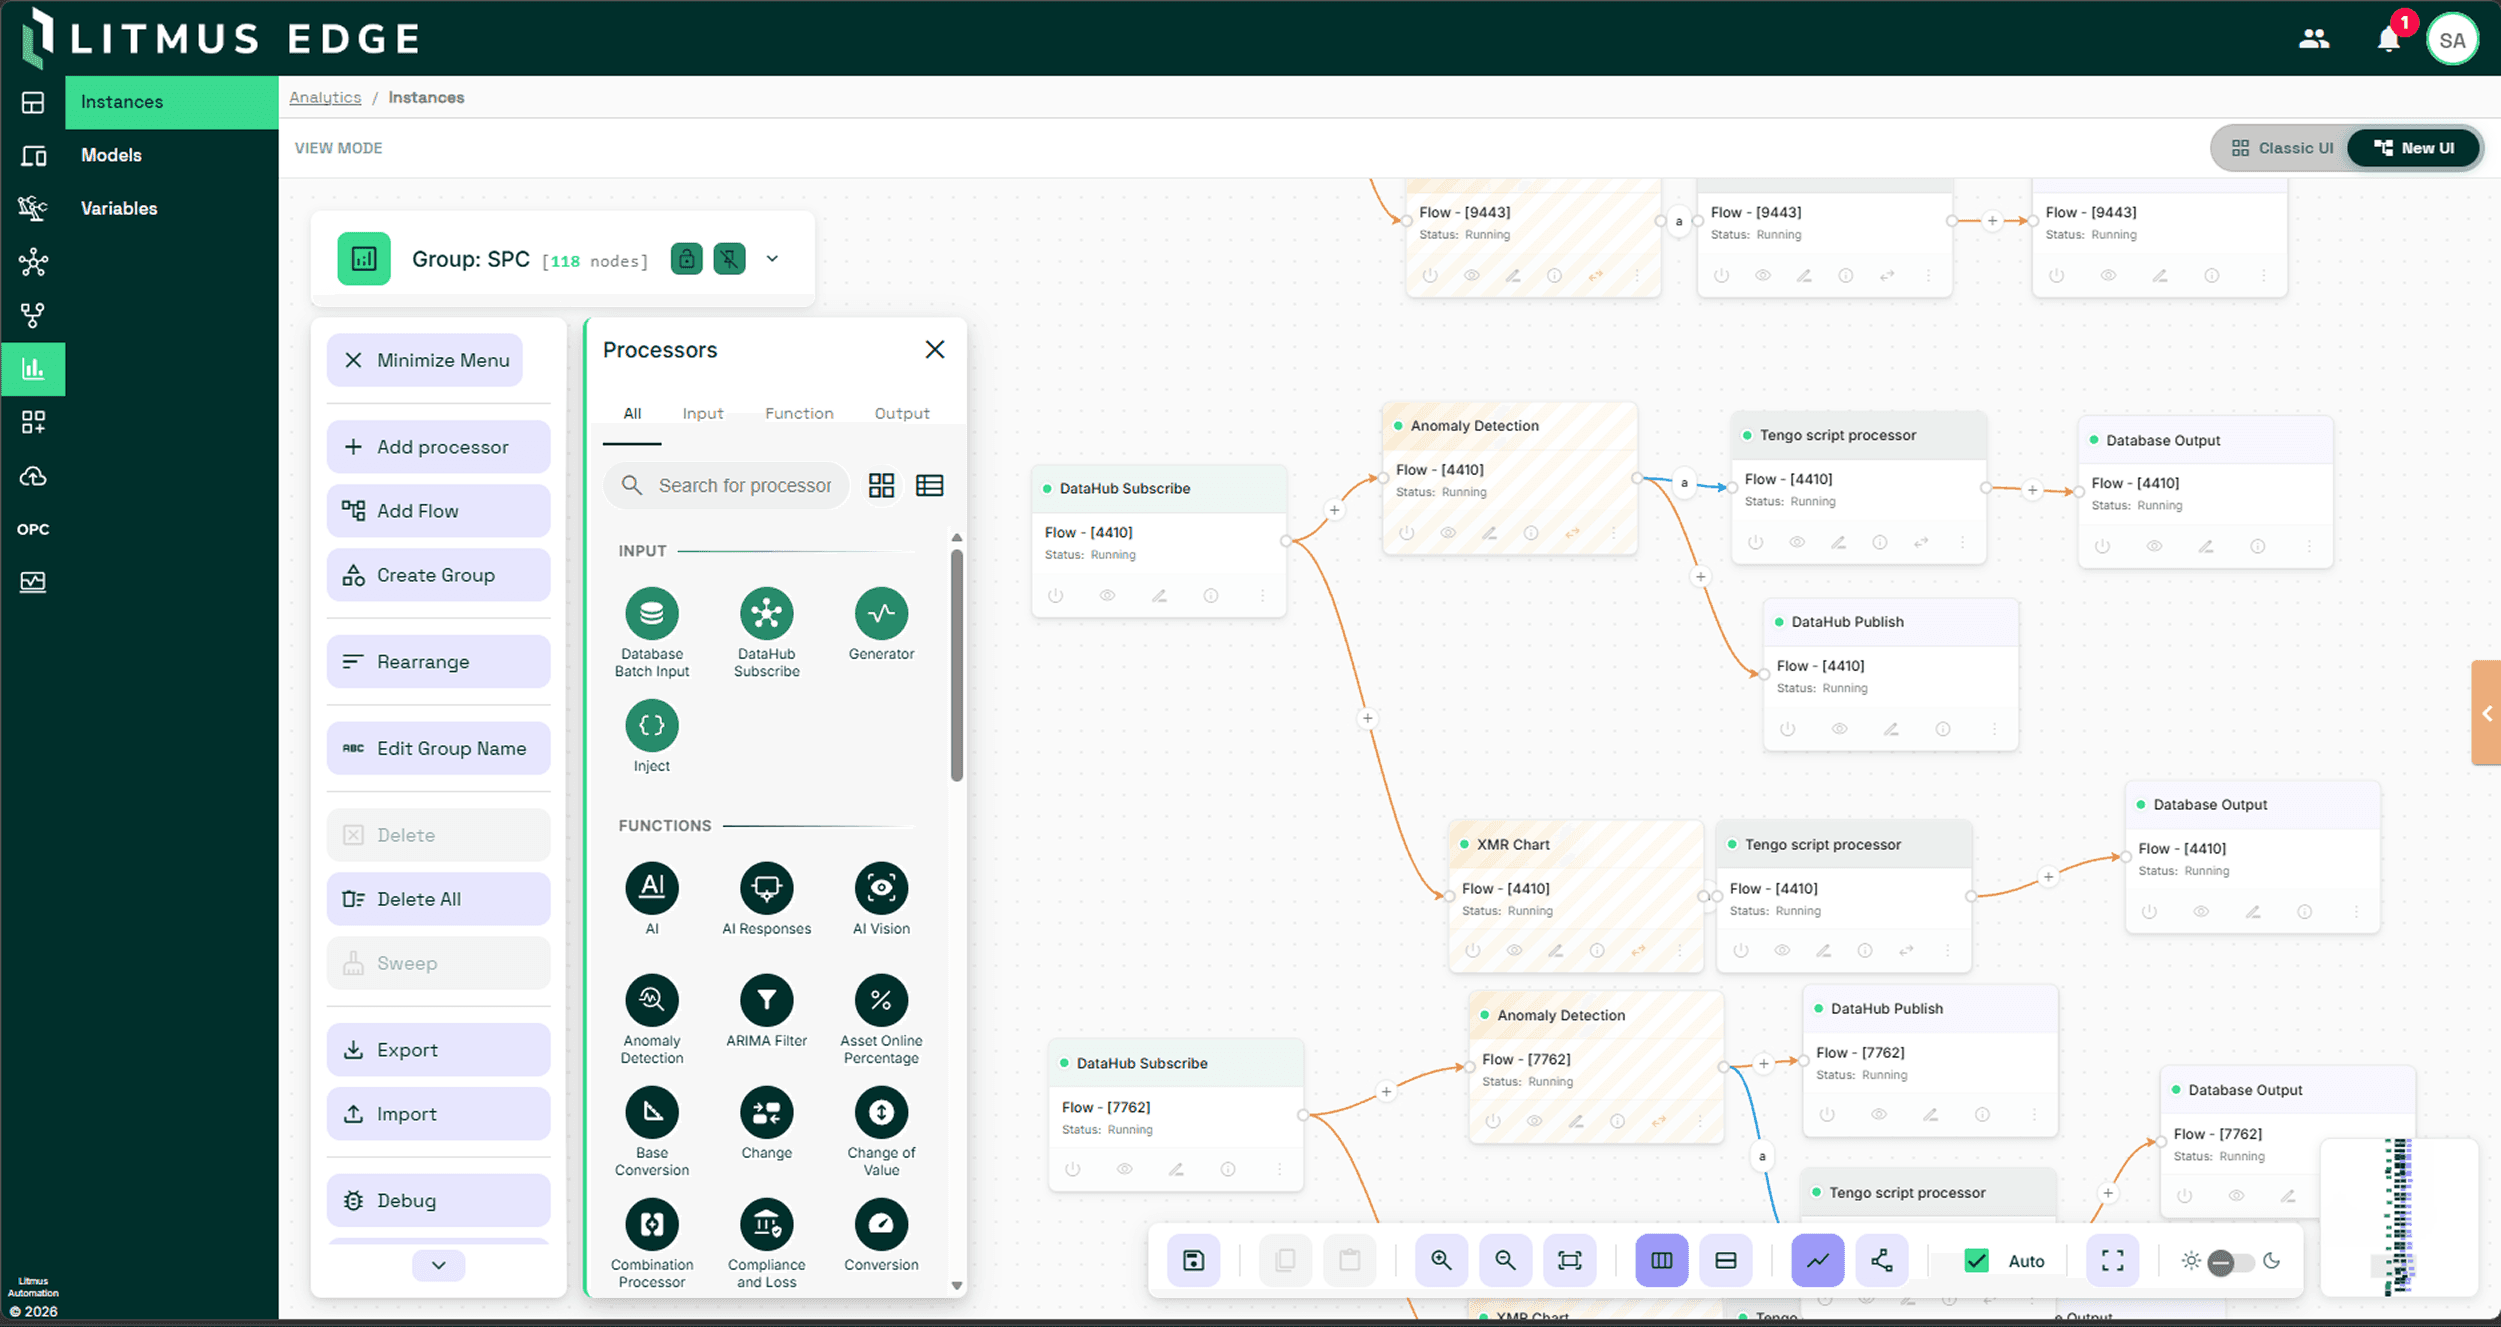
Edge Analytics in Litmus Edge is a no-code/low-code flow-based engine for processing and analyzing industrial data directly at the source. Each analytics flow chains together three types of processors — Input Processors, Function Processors, and Output Processors — to collect data, apply logic or AI, and publish results to a tag, topic, or database. With more than 30 built-in statistical functions, pre-configured industrial KPI processors, and native support for TensorFlow, SLM, and LLM models, the Analytics module covers the end-to-end DataOps lifecycle without leaving the edge.
Every analytics flow in Litmus Edge follows a three-stage pipeline, each stage served by a distinct processor category.
Input Processors
These are responsible for data ingestion. You choose the source: a DataHub Subscribe processor pulls live tag data from a connected OT device; a Database Batch Input processor polls the edge-local time-series database at a configurable interval; a Generator processor creates synthetic signals for testing and validation; an Inject processor manually fires events on demand. Each processor is configured through a dialog — no scripting, no YAML, no custom connectors to write.
Function Processors
These are where the analytical work happens. This is the engine of the flow — the layer where your data gets transformed, enriched, scored, or predicted. You pick a function from a categorized list, configure its parameters, and wire it to the input with either an Events connection (reacts to each individual data value) or a Values connection (waits for synchronized data from multiple inputs before computing). Both connection types are drag-and-drop on the analytics canvas.
Output Processors
Output processor close the loop. Results from a function can be written to a DataHub Publish topic for downstream consumption, stored via a Database Output processor into the edge-local metrics database, exported to a file in JSON, CSV, or Parquet format via a File Write processor, or printed to console via Stdout for diagnostic purposes. The DataHub Publish processor also supports dynamic topic generation, so output routing can be driven by expression logic rather than hard-coded configuration.
This three-stage, processor-chained design means any data operation — from unit conversion to anomaly detection to LLM inference — is expressed the same way, using the same canvas, by the same person who knows the process.
Industrial teams spend weeks building KPI calculations from scratch. Litmus Edge eliminates that work with a library of pre-configured KPI processors that cover the most common production monitoring requirements out of the box.
Each KPI processor is a purpose-built Function Processor — drop it into a flow, configure event triggers and thresholds, and it starts producing values immediately. Confirmed KPI processors in the platform include:
Online and Offline Percentage
Tracks how long a sensor or device was functional vs. offline, with configurable units (seconds, minutes, hours, days, weeks) and a resetOnStatus parameter that resets the counter on each state change
Uptime and Downtime by Value
Compares current tag values against a desired value using configurable conditions (>, <, ==, !=) with a delta tolerance for rounding errors
Production Cycle and Cycle Time Ratio (CTR)
Measures actual production time against an ideal cycle time, using manufactureStart and manufactureEnd event definitions to mark cycle boundaries
Manufacture Counter and Capacity Utilization
Counts total units manufactured in a period and calculates capacity utilization against an ideal output target
Maintenance and Failure
Tracks maintenance events per cycle, time since last maintenance, number of faults detected in a period, and time since last failure
Compliance and Loss
Computes compliance rate and loss percentage from manufactureEnd and defectiveUnit event triggers, giving a direct quality yield metric per cycle
These KPIs address availability, performance, quality, and maintenance — the four pillars of OEE-style monitoring — without requiring a single line of custom calculation logic.
When pre-built KPIs aren't enough, the statistical function library gives data engineers and plant automation teams a deep set of analytical operations to build from. Litmus Edge currently ships with more than 30 statistical function processors, covering every major category of operational data analysis:
Signal processing and transformation:
Gaussian Filter (noise removal from sensor data), Signal Decomposition (separates DC, AC, and noise components), Normalization (scales values to a common range), Rounding, Conversion (unit-to-unit conversions including temperature, angles, timestamps), and Base Conversion.
Pattern and trend detection:
Rise and Fall (identifies upward and downward trends in tag values), Moving Window (rolling calculations over a configurable time window), Simple Window, Linear Prediction (projects future values from historical trends), and Statistical Prediction (generates predictions from historical sensor patterns for tasks like predictive maintenance).
Aggregation and combination:
Inputs (Average, Maximum, Minimum, Sum across multiple data sources), Join Processor (combines data from multiple sensors into a unified output), and Combination Processor.
Quality and distribution:
Statistical Tests (Jarque-Bera, Cramér-von Mises, and Anderson-Darling tests to evaluate whether data conforms to a specified distribution), SPC Charts (Statistical Process Control), and XMR Chart (Individual and Moving Range chart for process variation monitoring).
Feature engineering:
Feature Extractor (extracts structured features from raw signals for use in downstream ML pipelines), Change (detects value transitions between defined states), and Switch (conditional routing of data based on value logic).
AI and ML execution:
TensorFlow Processor, TensorFlow Images Processor, AI Processor, and AI Vision Processor — all covered in the next section.
Custom logic:
JavaScript Processor and Tengo Script — for calculations that don't fit a pre-built function.
That last category is the escape path for edge cases. When the built-in library doesn't cover a specific formula, process metric, or transformation logic, you write it directly in the JavaScript Processor or Tengo Script function. This keeps the platform genuinely flexible: no-code for 90% of use cases, low-code when the process demands it.
The Analytics module treats AI inference as a first-class processor type — not a separate system, not a cloud call, not a side deployment.
TensorFlow Processor and TensorFlow Images Processor let you load a SavedModel (a complete TensorFlow program including weights and computation graph) directly into an analytics flow. Once loaded under the Created Models section, the model becomes a selectable function in the flow builder. You wire your Input Processor to the TensorFlow Processor, configure the input/output field mappings, and the model runs locally at inference time. This supports classification, regression, and anomaly detection workflows on streaming OT data without any cloud dependency.
For structured AI interactions within operational workflows, Litmus Edge supports SLM (Small Language Model) and LLM (Large Language Model) runtimes through the AI Processor. This means you can embed a language model directly in an analytics flow — for example, to generate natural-language summaries of process conditions, classify free-text alarm descriptions, or translate sensor context into structured operational instructions. The AI Vision Processor extends this to image and video inputs, enabling visual inspection workflows to be treated as native analytics steps.
All of this inference executes locally. There's no data leaving the plant floor, no round-trip latency to a cloud endpoint, and no dependency on network connectivity. For air-gapped or bandwidth-constrained industrial environments, this is the only viable path to real-time AI at scale.
The architectural choice — where to run analytics — has direct consequences for latency, data sovereignty, and resilience.
Latency.
A cloud round-trip for a real-time control decision adds hundreds of milliseconds at minimum. An analytics flow running locally in Litmus Edge responds in milliseconds, with results published to a DataHub topic the moment a function processor fires. For process monitoring, alarm detection, and closed-loop control, that difference is the gap between catching a problem and missing it.
Data sovereignty.
Many industrial environments — operate under strict data residency and compliance requirements. Raw OT data often cannot leave the facility. Edge-local analytics means sensitive process data stays where it was generated. Only processed results, aggregated metrics, or contextualized outputs need to travel upstream.
Resilience.
Cloud-dependent analytics pipelines stop working when the network drops. Litmus Edge supports offline-first and air-gapped deployments, which means analytics flows continue running and writing to local storage regardless of upstream connectivity. When the network returns, data can be backfilled through the edge-local time-series database.
DataOps completeness.
Most standalone analytics tools cover one part of the pipeline — transformation, or visualization, or model serving. Litmus Edge Analytics covers the entire DataOps cycle: ingest from OT sources via Input Processors, transform and enrich via Function Processors, publish results via Output Processors, and feed those results back into Digital Twins, Flows, or downstream cloud integrations — all from one canvas.
OT and plant automation engineers use the KPI library and statistical function library to stand up production monitoring in hours, not weeks. They configure a DataHub Subscribe Input Processor pointed at a PLC tag, drop in an Uptime/Downtime by Value KPI, and route output to a DataHub Publish topic feeding the operations dashboard. No scripting. No external tooling.
Data engineers build custom DataOps pipelines using the full function library. A typical flow might chain a Database Batch Input, through a Feature Extractor and Normalization function, into a TensorFlow Processor running a predictive maintenance model, with output written to both a Database Output (for historian storage) and a DataHub Publish topic (for live alerting). The analytics canvas makes the data lineage of that flow visible and editable.
Industrial AI teams deploy and iterate on ML models without leaving the platform. They upload a SavedModel under Created Models, wire it into a flow alongside pre-processing functions like Gaussian Filter or Normalization, and validate output using the Debug Panel before pushing the flow to production.
The Analytics module is available natively in Litmus Edge under Analytics. Creating your first flow takes three steps: select an Input Processor, select a Function Processor, select an Output Processor, and the wizard wires the connections automatically.
For a hands-on introduction, the Litmus Edge Analytics documentation covers flow creation, all processor types, the full KPI and statistical function reference, and ML model integration guides.
To explore the platform directly, sign up for a free Litmus Edge Developer Edition or book a demo with the Litmus team.
- 1.
What is the difference between an Input Processor, Function Processor, and Output Processor in Litmus Edge Analytics? Input Processors ingest data from tags, databases, or generators. Function Processors apply statistical logic, KPI calculations, or AI model inference to that data. Output Processors write the results to a topic, database, or file. Every analytics flow requires at least one of each, connected in sequence on the analytics canvas.
- 2.
Can I write custom code inside an analytics flow in Litmus Edge? Yes. The JavaScript Processor and Tengo Script function processors let you write custom calculation logic for cases not covered by the built-in function library. This gives you a no-code path for standard operations and a low-code escape path when your process has unique requirements.
- 3.
Does Litmus Edge Analytics require cloud connectivity to run AI/ML models? No. TensorFlow models, SLMs, and LLMs are loaded directly onto the Litmus Edge node and execute locally. Analytics flows — including AI inference steps — continue running in fully air-gapped or offline deployments with no cloud dependency.
- 4.
What output formats does the Analytics module support? Output Processors can write to a DataHub topic (for real-time pub/sub distribution), to the edge-local time-series database (for historical storage and backfill), and to files in JSON, CSV, or Parquet format. Dynamic topic generation in DataHub Publish allows output routing to be expression-driven rather than statically configured.