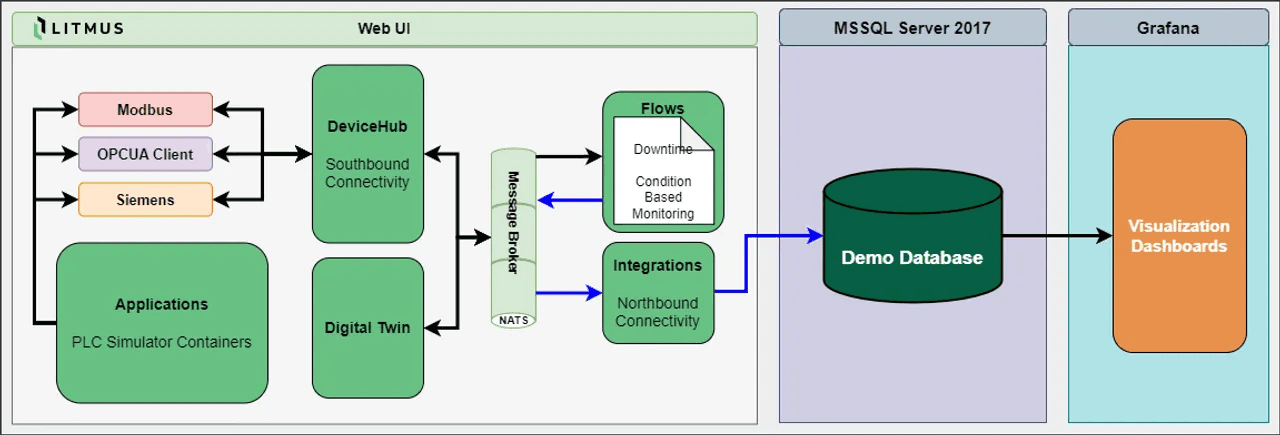
A self-contained smart factory that customers and sales teams can stand up to see Litmus Edge work end to end, from the PLC to the dashboard.
Sixteen simulated PLCs, four on each of OPC UA, Modbus TCP, Siemens S7 and Rockwell EtherNet/IP, all read by one Litmus Edge. Every machine runs a production cycle with faults, parts made, quality codes, temperature and speed, and its behaviour can be tuned live while the demo runs.
16 PLCs across four industrial protocols, with no gateway in between
a Simulator Control Center web UI to change uptime, fault rates, cycle time and scrap intervals per machine
fault and reason codes resolved against seeded lookup tables
What it configures on Litmus Edge
On startup, a one-shot template applier connects the Edge to the simulators and the databases:
16 DeviceHub devices and their tags
flows that record production, downtime and scrap to MSSQL and MySQL
the SQL connectors and integrations those flows use
Dashboards
Provisioned in Grafana, reading the SQL stores and the Edge's time-series data:
executive OEE
downtime analysis
energy monitoring
SPC charts
scrap reporting
process control
Deployment options
Inside an existing Litmus Edge, as a demo install on the Edge's own Docker engine, online or offline
Standalone Docker Compose, bringing its own Litmus Edge
Kubernetes (k3s) manifests
Notes
Requires a valid Litmus Edge license.
Once installed, Grafana is on port 3000 and the Simulator Control Center on port 3300
Stay in the loop! Get notified when we publish new solutions.