Industrial operations move fast, but the software that supports them often doesn’t. Teams still spend too much time jumping between dashboards, hunting for the right device, searching through tag lists, exporting data, and writing one-off scripts just to answer basic questions like:
Which devices are connected right now?
What’s the current value of this tag?
What changed in the last hour?
Is telemetry flowing on the topic I care about?
Which edge applications are running, and can I deploy a new one safely?
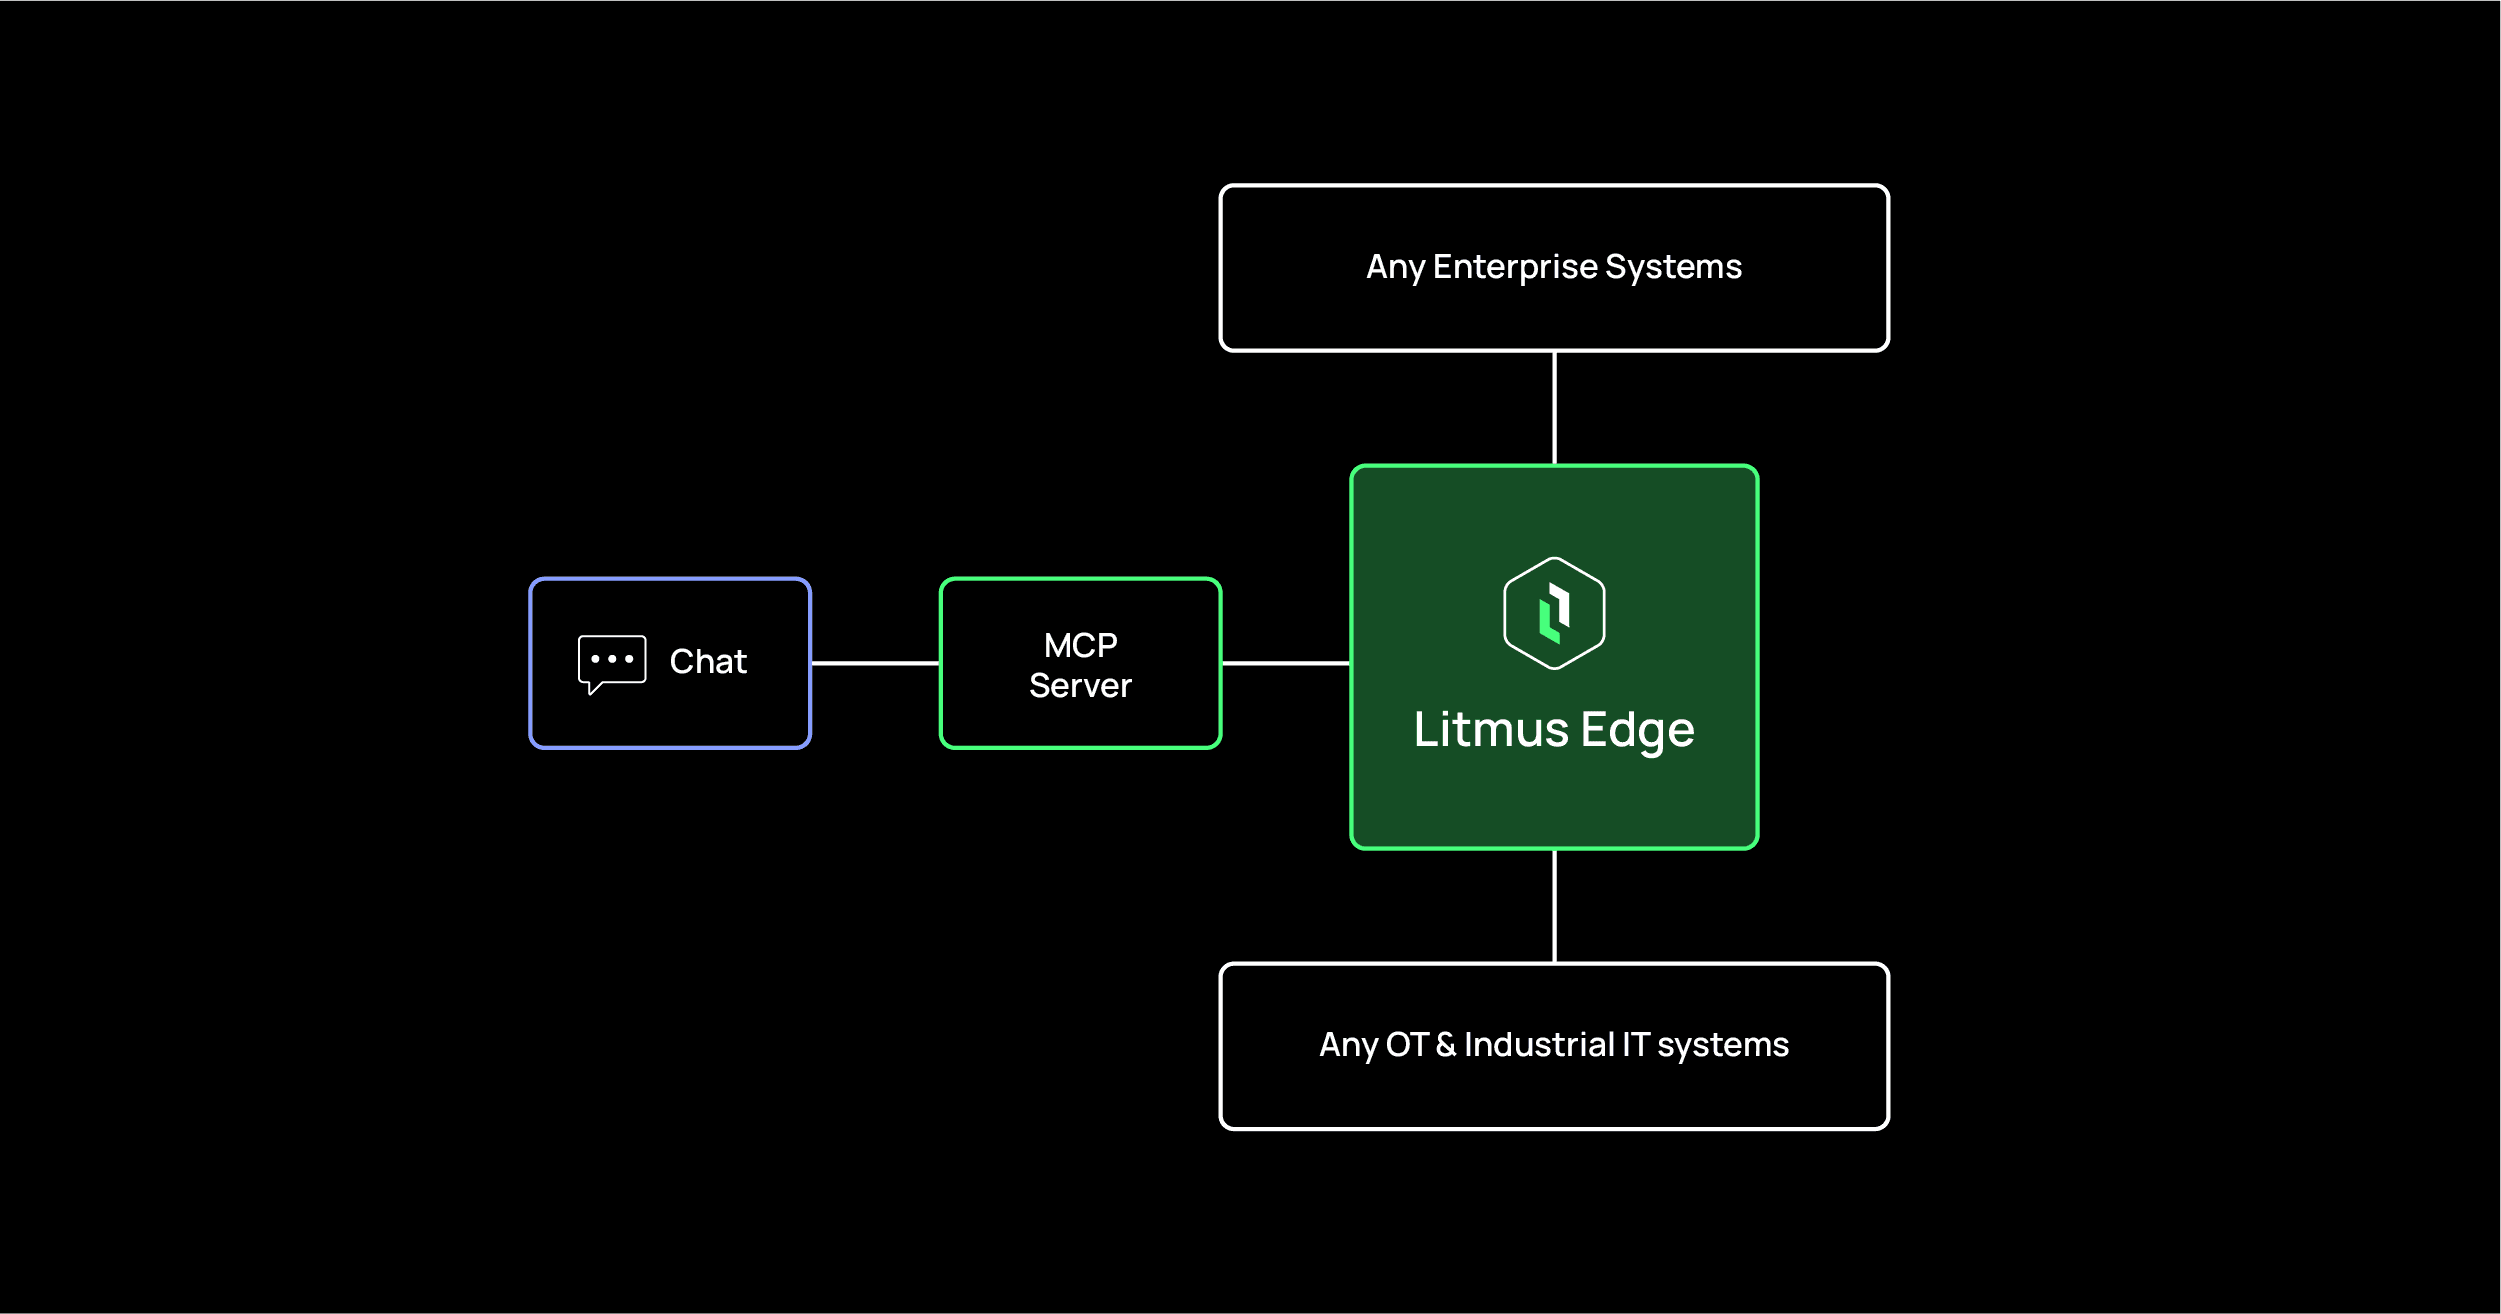
The Litmus MCP Server is built to remove that friction by exposing Litmus Edge capabilities as AI-callable tools using MCP (Model Context Protocol). But the biggest unlock for product adoption is simple: You can start using it immediately through a built-in Web UI (chat interface), without setting up any external MCP client.
This post explains what the Litmus MCP Server Web UI is, why it matters, and how it helps teams move from “manual edge ops” to “AI-assisted edge ops” — quickly and safely.

The Litmus MCP Server is a service that connects AI tools to Litmus Edge so you can perform real operational tasks using natural language.
Think of it as a bridge:
On one side: Litmus Edge capabilities (Device drivers, data streams, time-series history, app containers, Data models).
On the other side: AI experiences (chat interfaces, IDE assistants, agent workflows).
The Litmus MCP Server turns core edge operations into discoverable tools, such as:
Listing connected devices
Listing tags for a device
Reading a tag’s current value
Sampling live telemetry from messaging topics
Querying historical data from time-series storage
Listing and deploying edge containers
Listing Data models and creating instances
Viewing and managing data model hierarchy and attributes
The result: instead of manually clicking through multiple screens or writing custom scripts, you can ask for what you need and act on it instantly.
MCP integrations can sound complex because many people assume they need a dedicated MCP client before they can try anything. The Litmus MCP Server removes that barrier. The Docker image includes a built-in Web UI that gives you a chat interface right out of the box. You run the server, open the UI in a browser, add your Litmus Edge connection details, and start interacting. That matters because it changes adoption from “integration project” to “5-minute workflow demo.”
The Web UI helps you:
Prove value quickly, without waiting on IDE setup or client configuration
Demo real workflows live, using your own devices and tags
Validate connectivity and data flow before you operationalize anything
Create a shared experience across OT and IT stakeholders
Turn natural language into consistent, repeatable actions
Once you’ve validated what you want to do, you can connect the same MCP server to external MCP clients and IDE tools for deeper automation. But the Web UI is the shortest path from curiosity to capability.
Below are practical workflows that industrial teams do every day — now simplified into conversational actions.
Operations often begin with basic questions: What’s connected? What’s offline? What changed? With the Web UI, you can ask for:
A list of all configured devices
Connection state or availability indicators
Driver context (the protocol family used for each device)
A filtered view (show only offline devices, show devices by driver type, show recently added devices)
This is especially helpful when onboarding new assets, troubleshooting connectivity, or validating a deployment.
Anyone who has navigated long tag lists knows the problem: the information exists, but it’s hard to find quickly. With the Litmus MCP Server Web UI, you can:
List tags for a specific device
Search tag names using plain language
Group tags logically (temperatures, pressures, speeds, states)
Extract a short “best candidate” tag list for a specific question
Example outcomes:
“Show me the temperature tags on Line 2”
“Which tags look like machine state or run status?”
“List tags that likely represent alarms or fault codes”
This turns tag discovery into a guided experience instead of a manual hunt.
When something goes wrong, you need immediate visibility — not a report. The Web UI can help you:
Read the current value of a tag
Validate that a signal is live
Repeat sampling for a short window to see drift, oscillation, or sudden jumps
Summarize what changed across multiple tags
This is perfect for:
Commissioning new equipment
Confirming instrumentation or sensor wiring
Verifying that a PLC value is being ingested correctly
Quick triage during downtime
Many plants rely on streaming data for fast response, but troubleshooting streams can be difficult. With the Web UI, you can:
Subscribe to a topic and pull messages
Sample a batch of messages and summarize the structure
Identify missing fields, irregular values, or sudden format changes
Quickly confirm that telemetry is flowing and looks healthy
This is how teams avoid time-consuming “is it the network, the device, or the app?” debugging loops.
Real-time is useful. History is essential. The MCP server can query time-series history so you can ask questions like:
“Show me what happened over the last hour”
“Find spikes or drops between two timestamps”
“Compare today’s trend with yesterday”
“Summarize abnormal behaviour and when it started”
This is valuable for:
Root cause analysis
Predictive maintenance investigation
Validating process stability
Post-incident reporting
Edge apps are increasingly deployed as containers, but teams still manage them through repetitive steps. With the Web UI, you can:
List running containers
Confirm container health and state
Deploy a container with parameters
Validate it’s running properly after deployment
This simplifies edge application operations and makes deployments more consistent and less error-prone.
Raw signals aren’t enough for intelligent systems. Context matters. Data Models help define:
Asset identity
Attributes (static and dynamic)
Hierarchy (line → station → machine → component)
Relationships between assets and data
With the Web UI and MCP tools, you can:
List Data models and versions
Create Data Models instances for assets
Manage attributes and hierarchy
Query the structure and summarize it in human terms
This is where “AI-assisted operations” becomes truly scalable — because the AI is no longer guessing what a tag means. It has a structured representation of the plant.
Users express intent in natural language, and the system maps it to real operational capabilities.
The Web UI lets teams try real workflows without a long setup cycle. That makes adoption easier, demos stronger, and pilots faster.
Instead of writing scripts for every task, teams use a consistent tool interface that can be reused across clients, apps, and agents.
OT teams, IT teams, data teams, and reliability teams don’t need separate toolchains to get answers. They can converge on a single conversational operational layer.
What starts as chat can evolve into standard operating procedures, runbooks, and agent-driven automations — using the same underlying tool surface.
It is a browser-based chat interface included with the Litmus MCP Server that lets you interact with Litmus Edge using natural language without setting up an external MCP client first.
You can perform key Litmus Edge operational tasks through MCP tools, including device discovery, tag listing and reads, telemetry sampling, historical time-series queries, container management, and Digital Twin model and instance operations.
It is useful for OT teams, IT teams, reliability engineers, controls engineers, and data teams who need faster ways to understand and operate edge environments.
Because it standardizes how AI systems connect to real operational tools and data sources, enabling faster troubleshooting, more consistent workflows, and scalable automation across systems.
Industrial teams don’t need more dashboards. They need faster answers and safer actions.
The Litmus MCP Server Web UI makes that possible by giving you an immediate chat-based interface to Litmus Edge operations — from devices and tags to telemetry, history, containers, and Data models.
If you want to move from manual edge operations to AI-assisted edge operations, this is the simplest place to start: open the Web UI, connect your Litmus Edge, and begin operating with intent instead of clicks.
Get started: https://github.com/litmusautomation/litmus-mcp-server