A guide to connect LEM with a Syslog server.
Litmus Edge Manager incorporates Prometheus as an widely used open-source systems monitoring and alerting toolkit.
It was originally created 2012 at SoundCloud but is now a standalone open source project and maintained independently of any company.
Prometheus collects and stores its metrics as time series data, i.e. metrics information is stored with the timestamp at which it was recorded, alongside optional key-value pairs called labels.
Prometheus's main features include:
The main purpose is to collect what is called metrics or numerical measurements in layperson terms.
What users want to measure differs from application to application. For a web server, it could be request times; for a database, it could be the number of active connections or active queries, and so on.
Metrics play an important role in understanding why your application is working in a certain way.
For a system like Litmus Edge Manager, this would include the system performance like CPU, Memory or disk space.
As with more Litmus Edge Devices connected and more Companies and/or Projects, the originally allocated resources may run out and jobs like a Litmus Edge Update or Application push may be slowed down or even times out.
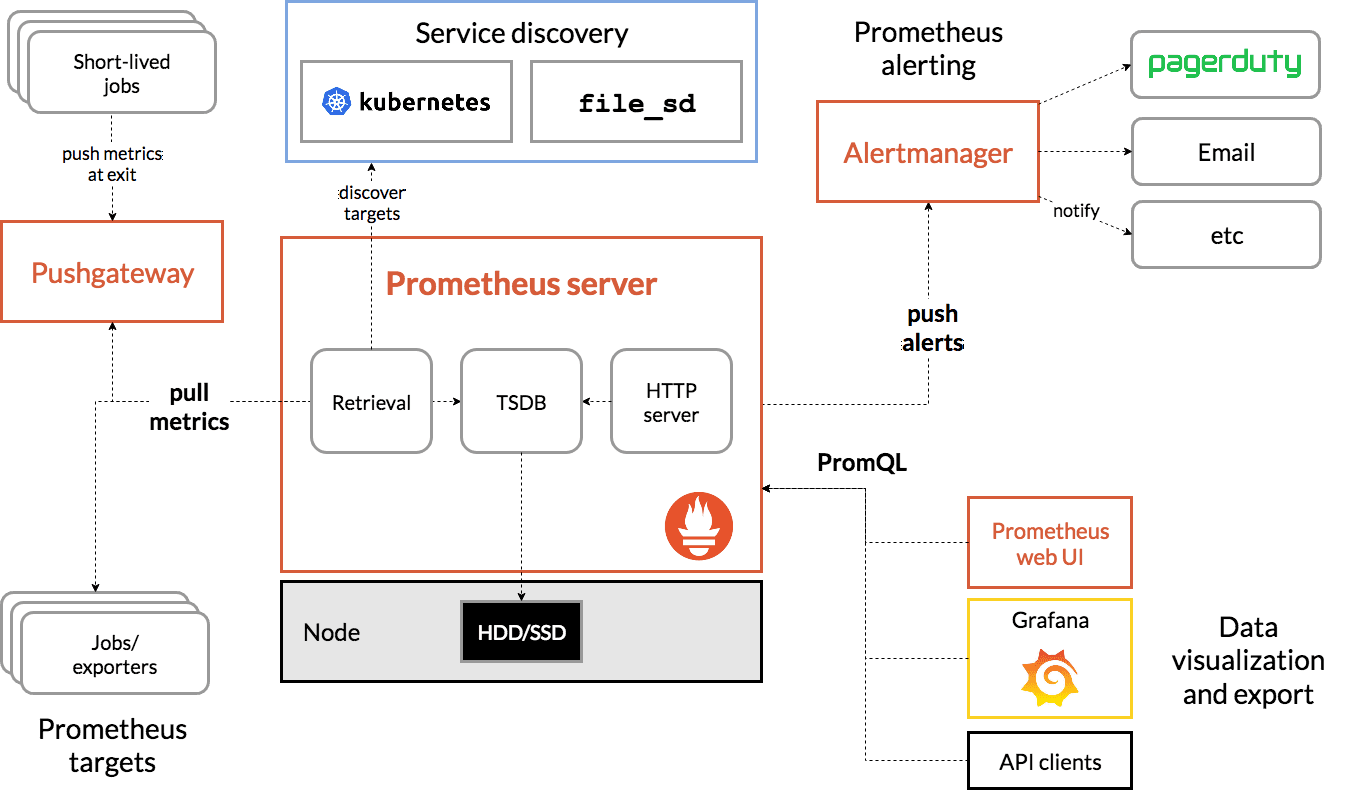
Prometheus scrapes metrics from instrumented jobs, either directly or via an intermediary push gateway for short-lived jobs. It stores all scraped samples locally and runs rules over this data to either aggregate and record new time series from existing data or generate alerts.
Grafana is named by the Prometheus project as a choice for visualizing metrics, since it supports Prometheus since 2015.
But users are not limited as other API consumers can be used to visualize the collected data too, such as logit.
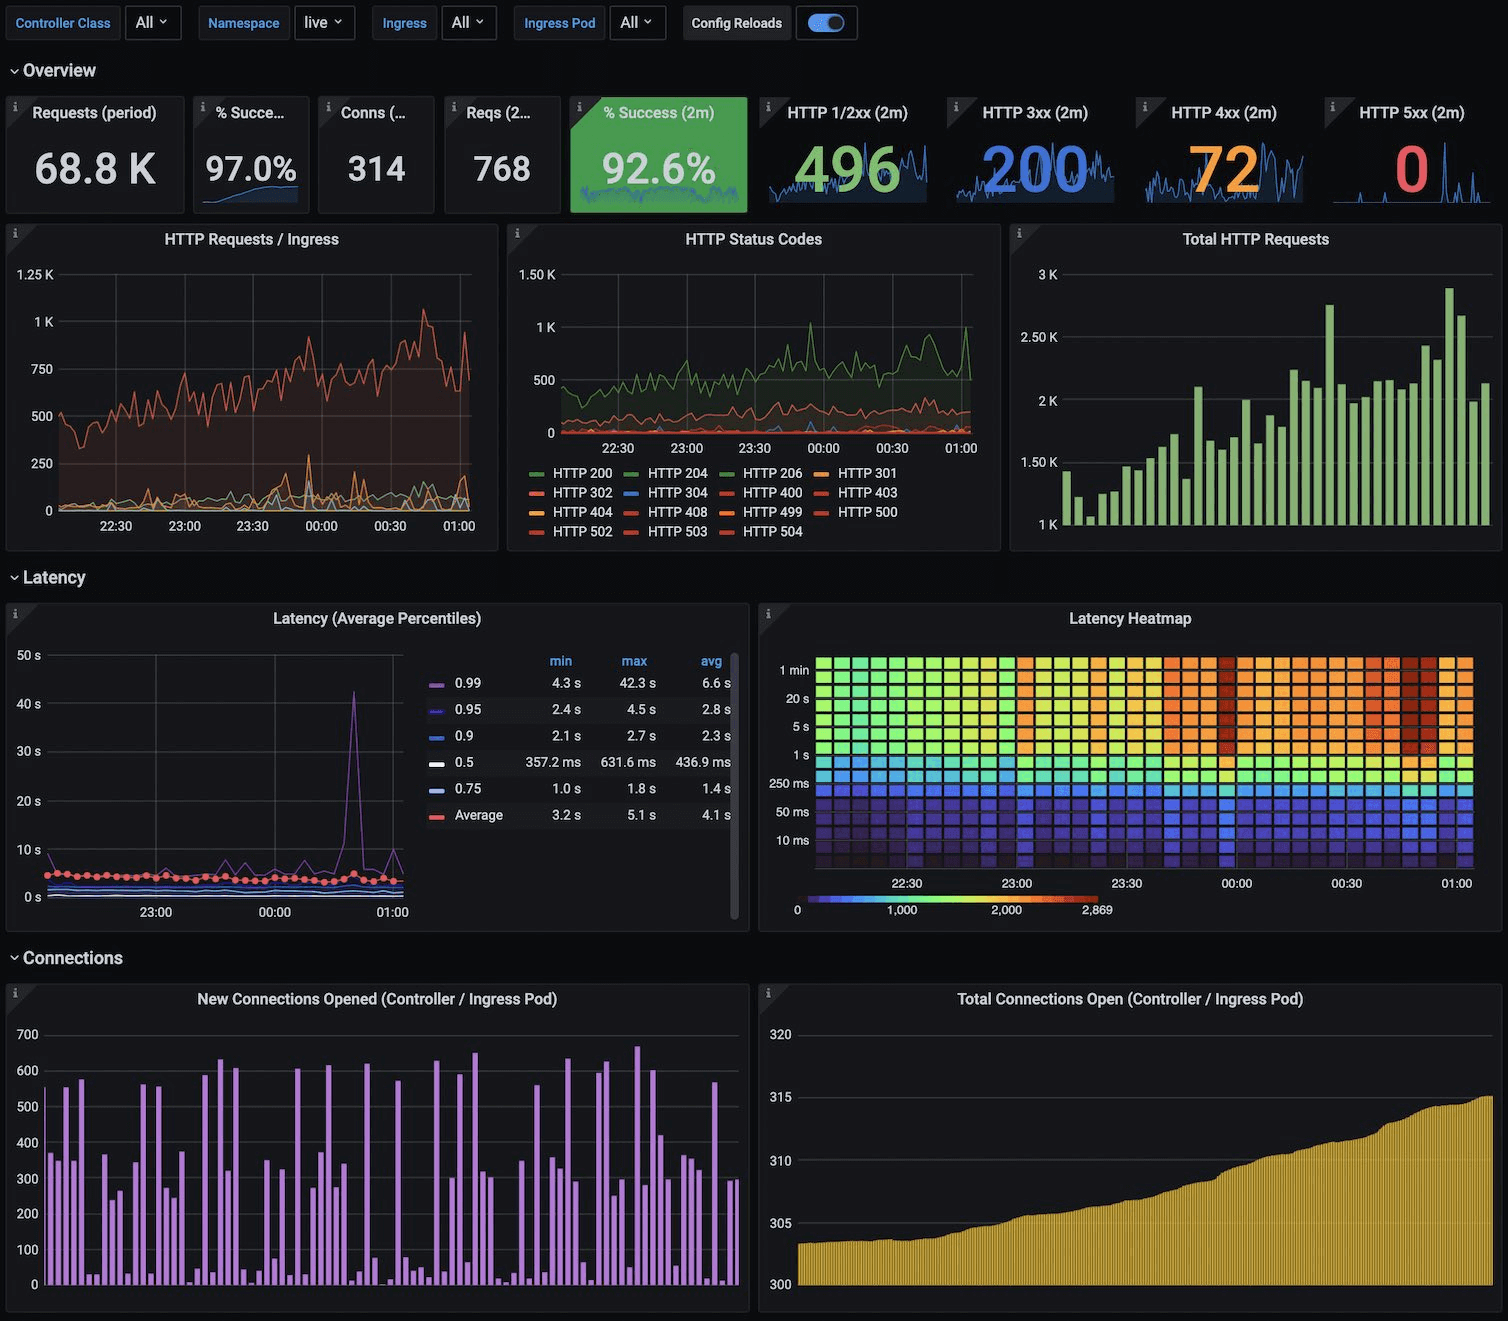
By default, Litmus Edge Manager does provide some default Grafana dashboards which includes one for Prometheus Metrics.
But if your organization does make use of an existing centralized visualization and alerting platform such as for example Grafana Cloud or logit, Litmus Edge Manager can easily be connected to these platforms and becomes part of your overall IT infrastructure.