Rolling out digital transformation across the factory floor is complex. Proving its value shouldn’t be. That’s why we created the Digital Factory Demo—a turnkey, self-contained sales demo that showcases what Litmus Edge can do in just minutes.
Whether you’re just curious, a partner, or an internal stakeholder looking to demonstrate the value of industrial AI, this is your express lane to understanding the scale, speed, and sophistication of Litmus’ edge data platform and its seamless data connectivity between OT and IT systems.
The Digital Factory Demo is a ready-to-deploy virtual environment that simulates a smart factory—complete with PLCs, containerized apps, digital twin templates, historical data, and live dashboards. It gives new users, partners, and buyers a real-world look at Litmus Edge in action, without needing to connect to a single physical device.
It’s not just a sample. It’s a starter pack, a proof of concept, and a powerful narrative tool—all in one, designed to show how industrial operations can leverage edge data for smarter insights and faster decision-making.
We built the Digital Factory Demo to remove the friction that typically slows down industrial digital transformation: long deployment cycles, complex integrations, and unclear ROI.
With this self-contained environment, users can explore real IIoT and industrial use cases in a matter of minutes, not months. That means faster time to value, a clearer path to ROI, and less risk of failure when proving out solutions to internal teams.
Manufacturing teams can immediately dive into high-impact use cases, including:
Overall Equipment Effectiveness (OEE) calculations
Downtime and scrap analysis
Statistical Process Control (SPC) insights
Real-time Grafana dashboards pre-loaded with factory data
Containerized workloads running at the edge
Predictive and preventive maintenance strategies
And because the entire experience is self-contained—no integration required—you can launch the demo in minutes and see a fully operational virtual factory spin up before your eyes. That includes pre-built production lines, machines, tag templates, historical data, and contextualized insights.
So whether you’re evaluating Litmus for rollout, training internal teams, or enabling sales conversations, the Digital Factory Demo accelerates understanding, validates capabilities, and builds stakeholder confidence.
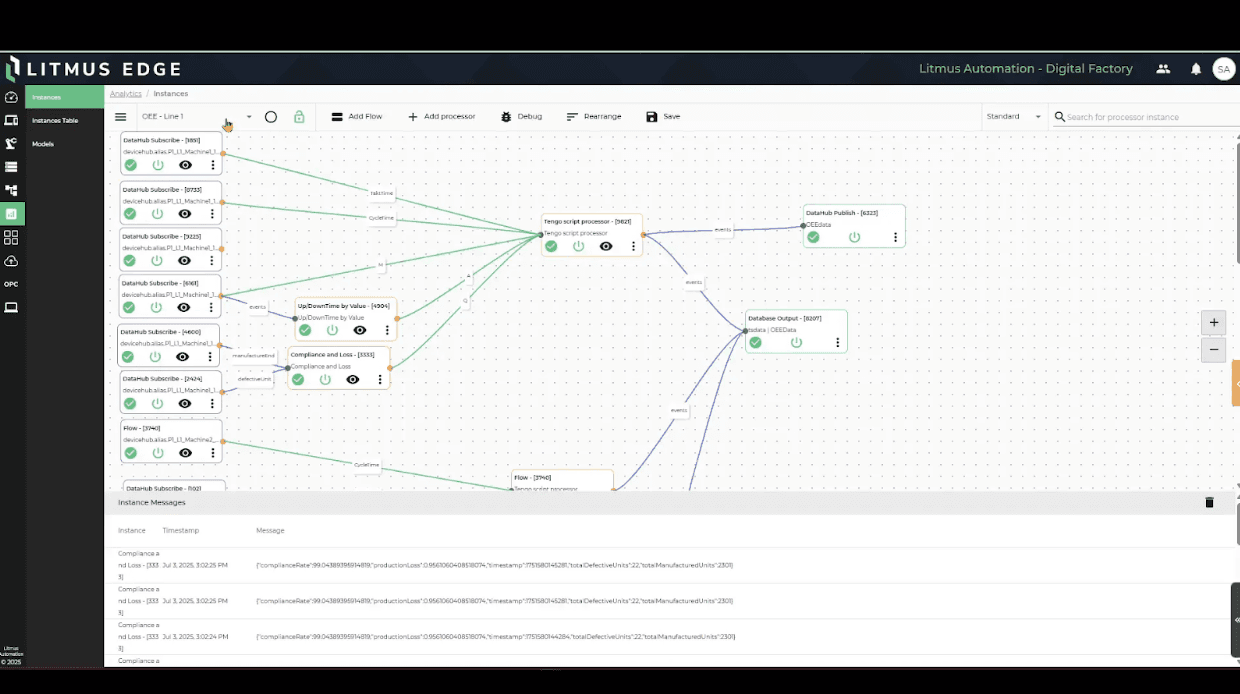
At the heart of the demo experience is the Litmus DeviceHub, which acts as a centralized gateway for ingesting and managing machine data. Devices are simulated using the most common industrial protocols—Siemens, Modbus, and OPCUA—forming the backbone of the virtual factory. While other connectors exist, these three form the backbone of the digital factory’s device ecosystem.
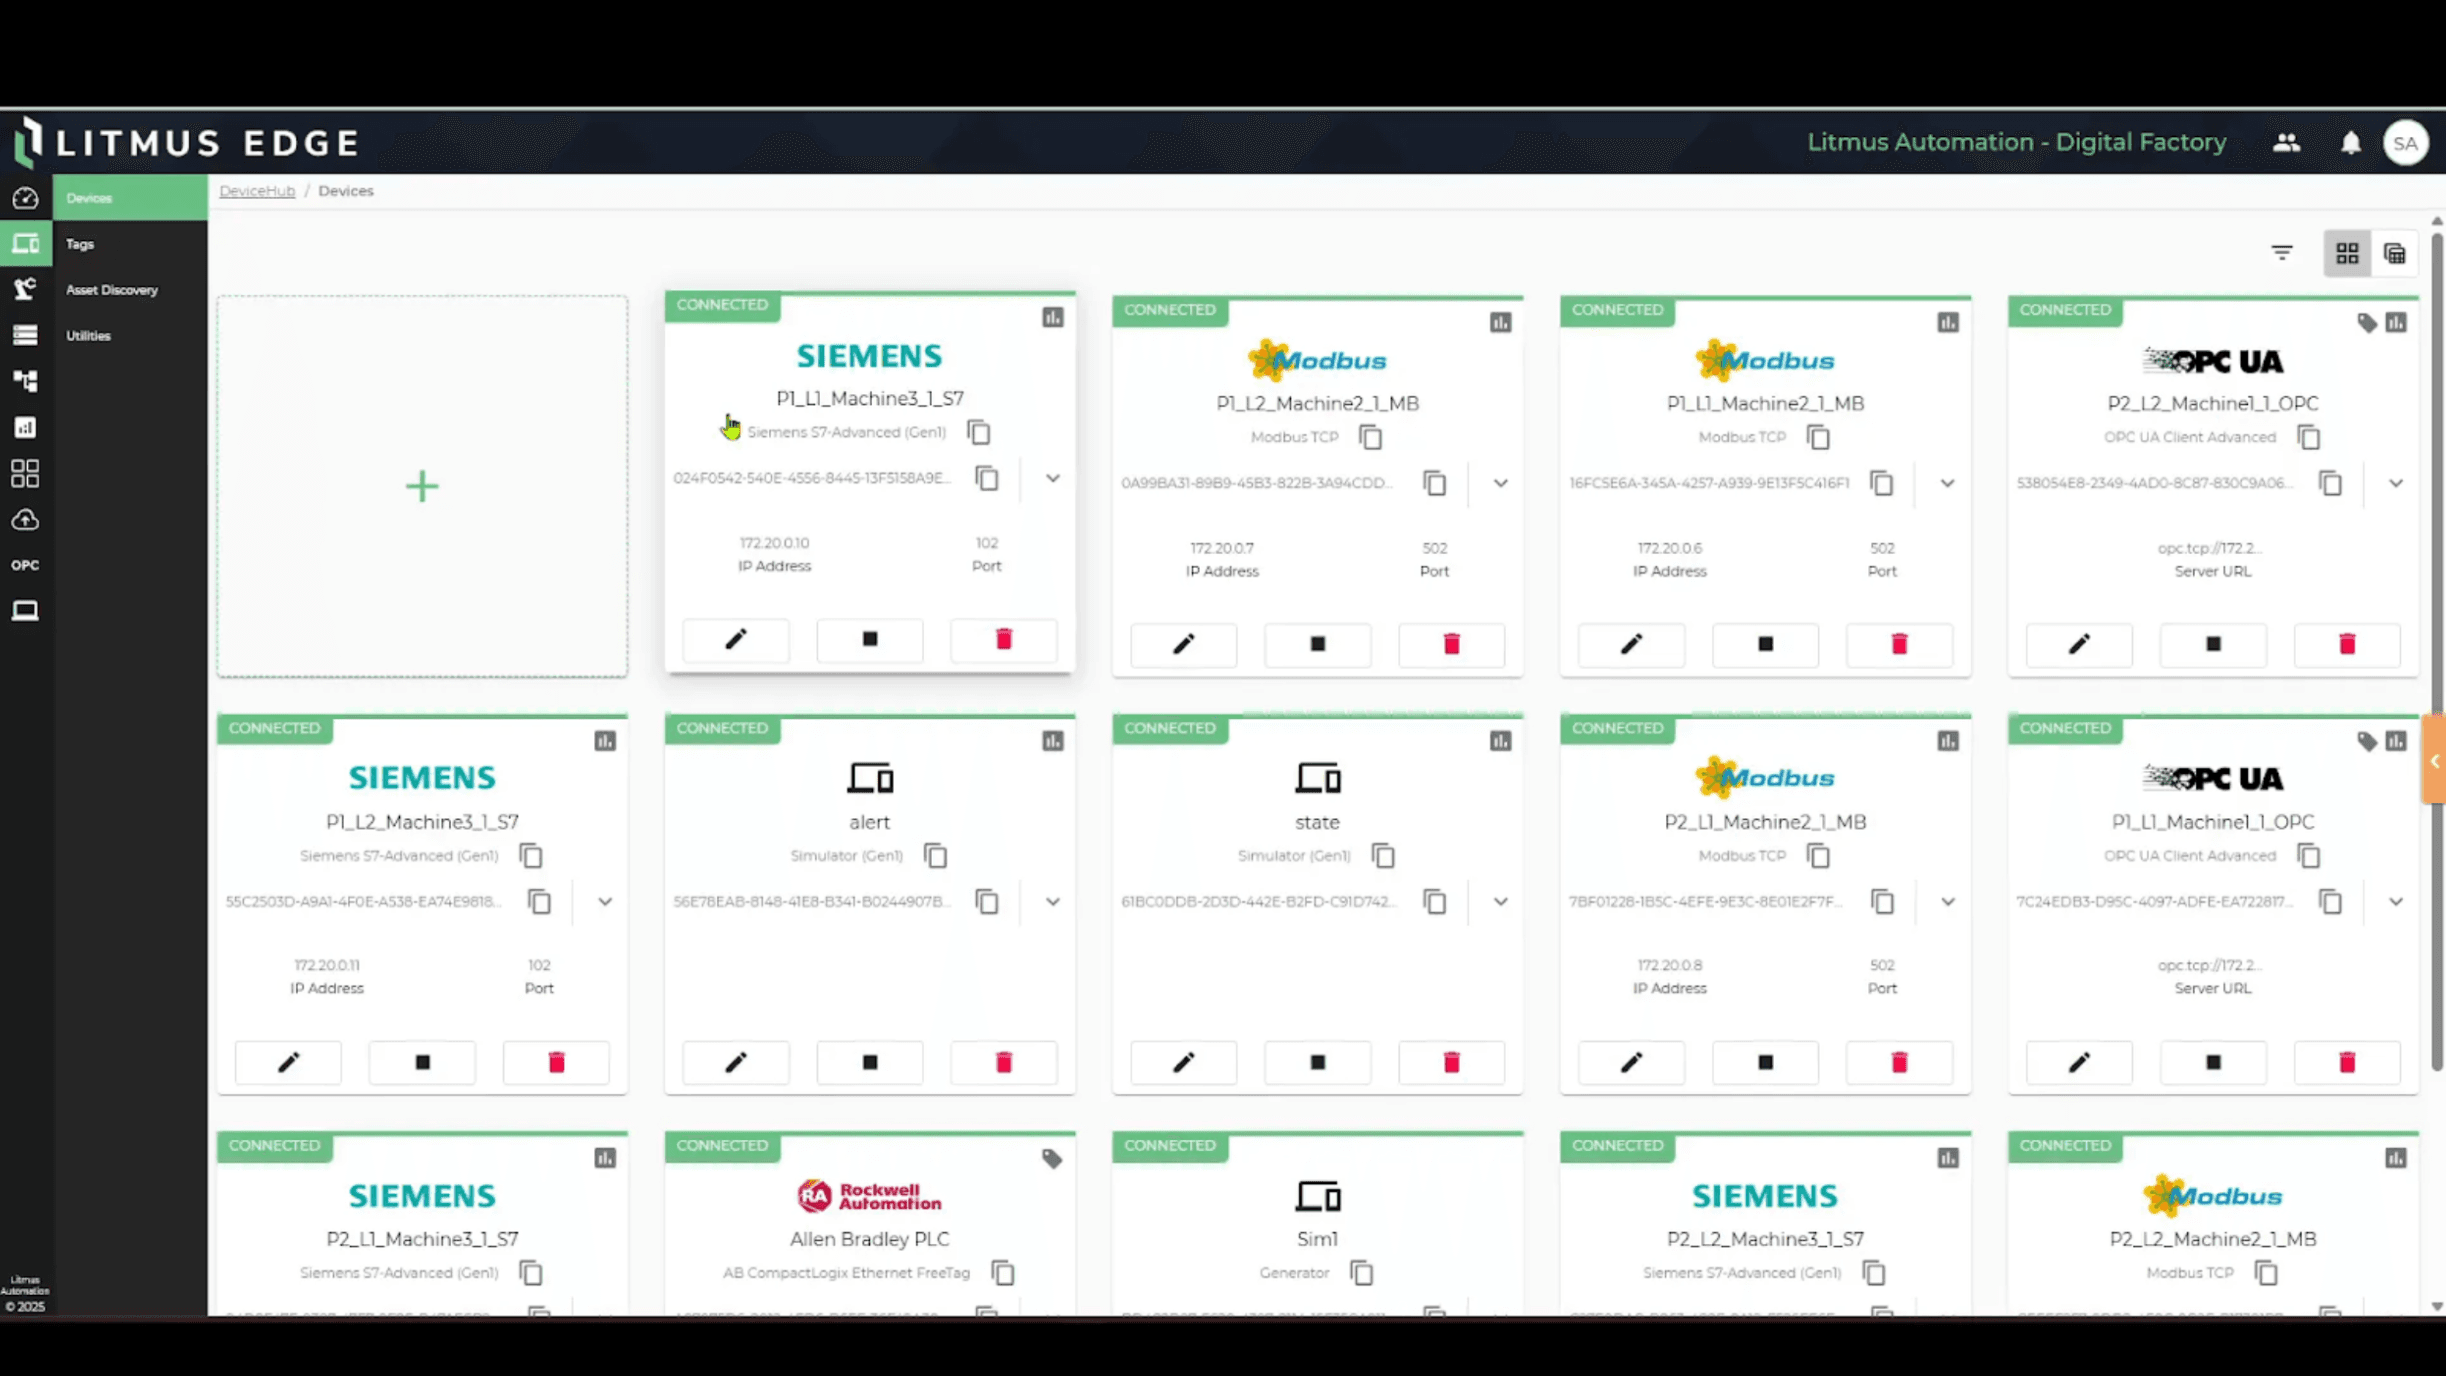
Each demo models two plants, each with two production lines, and three machines per line—mirroring how Litmus Edge operates in real-world environments.
What makes this structure even more powerful is the unified naming convention applied across all machines and lines. It ensures consistent, intuitive identification and querying, especially valuable when working with large volumes of time-series data.
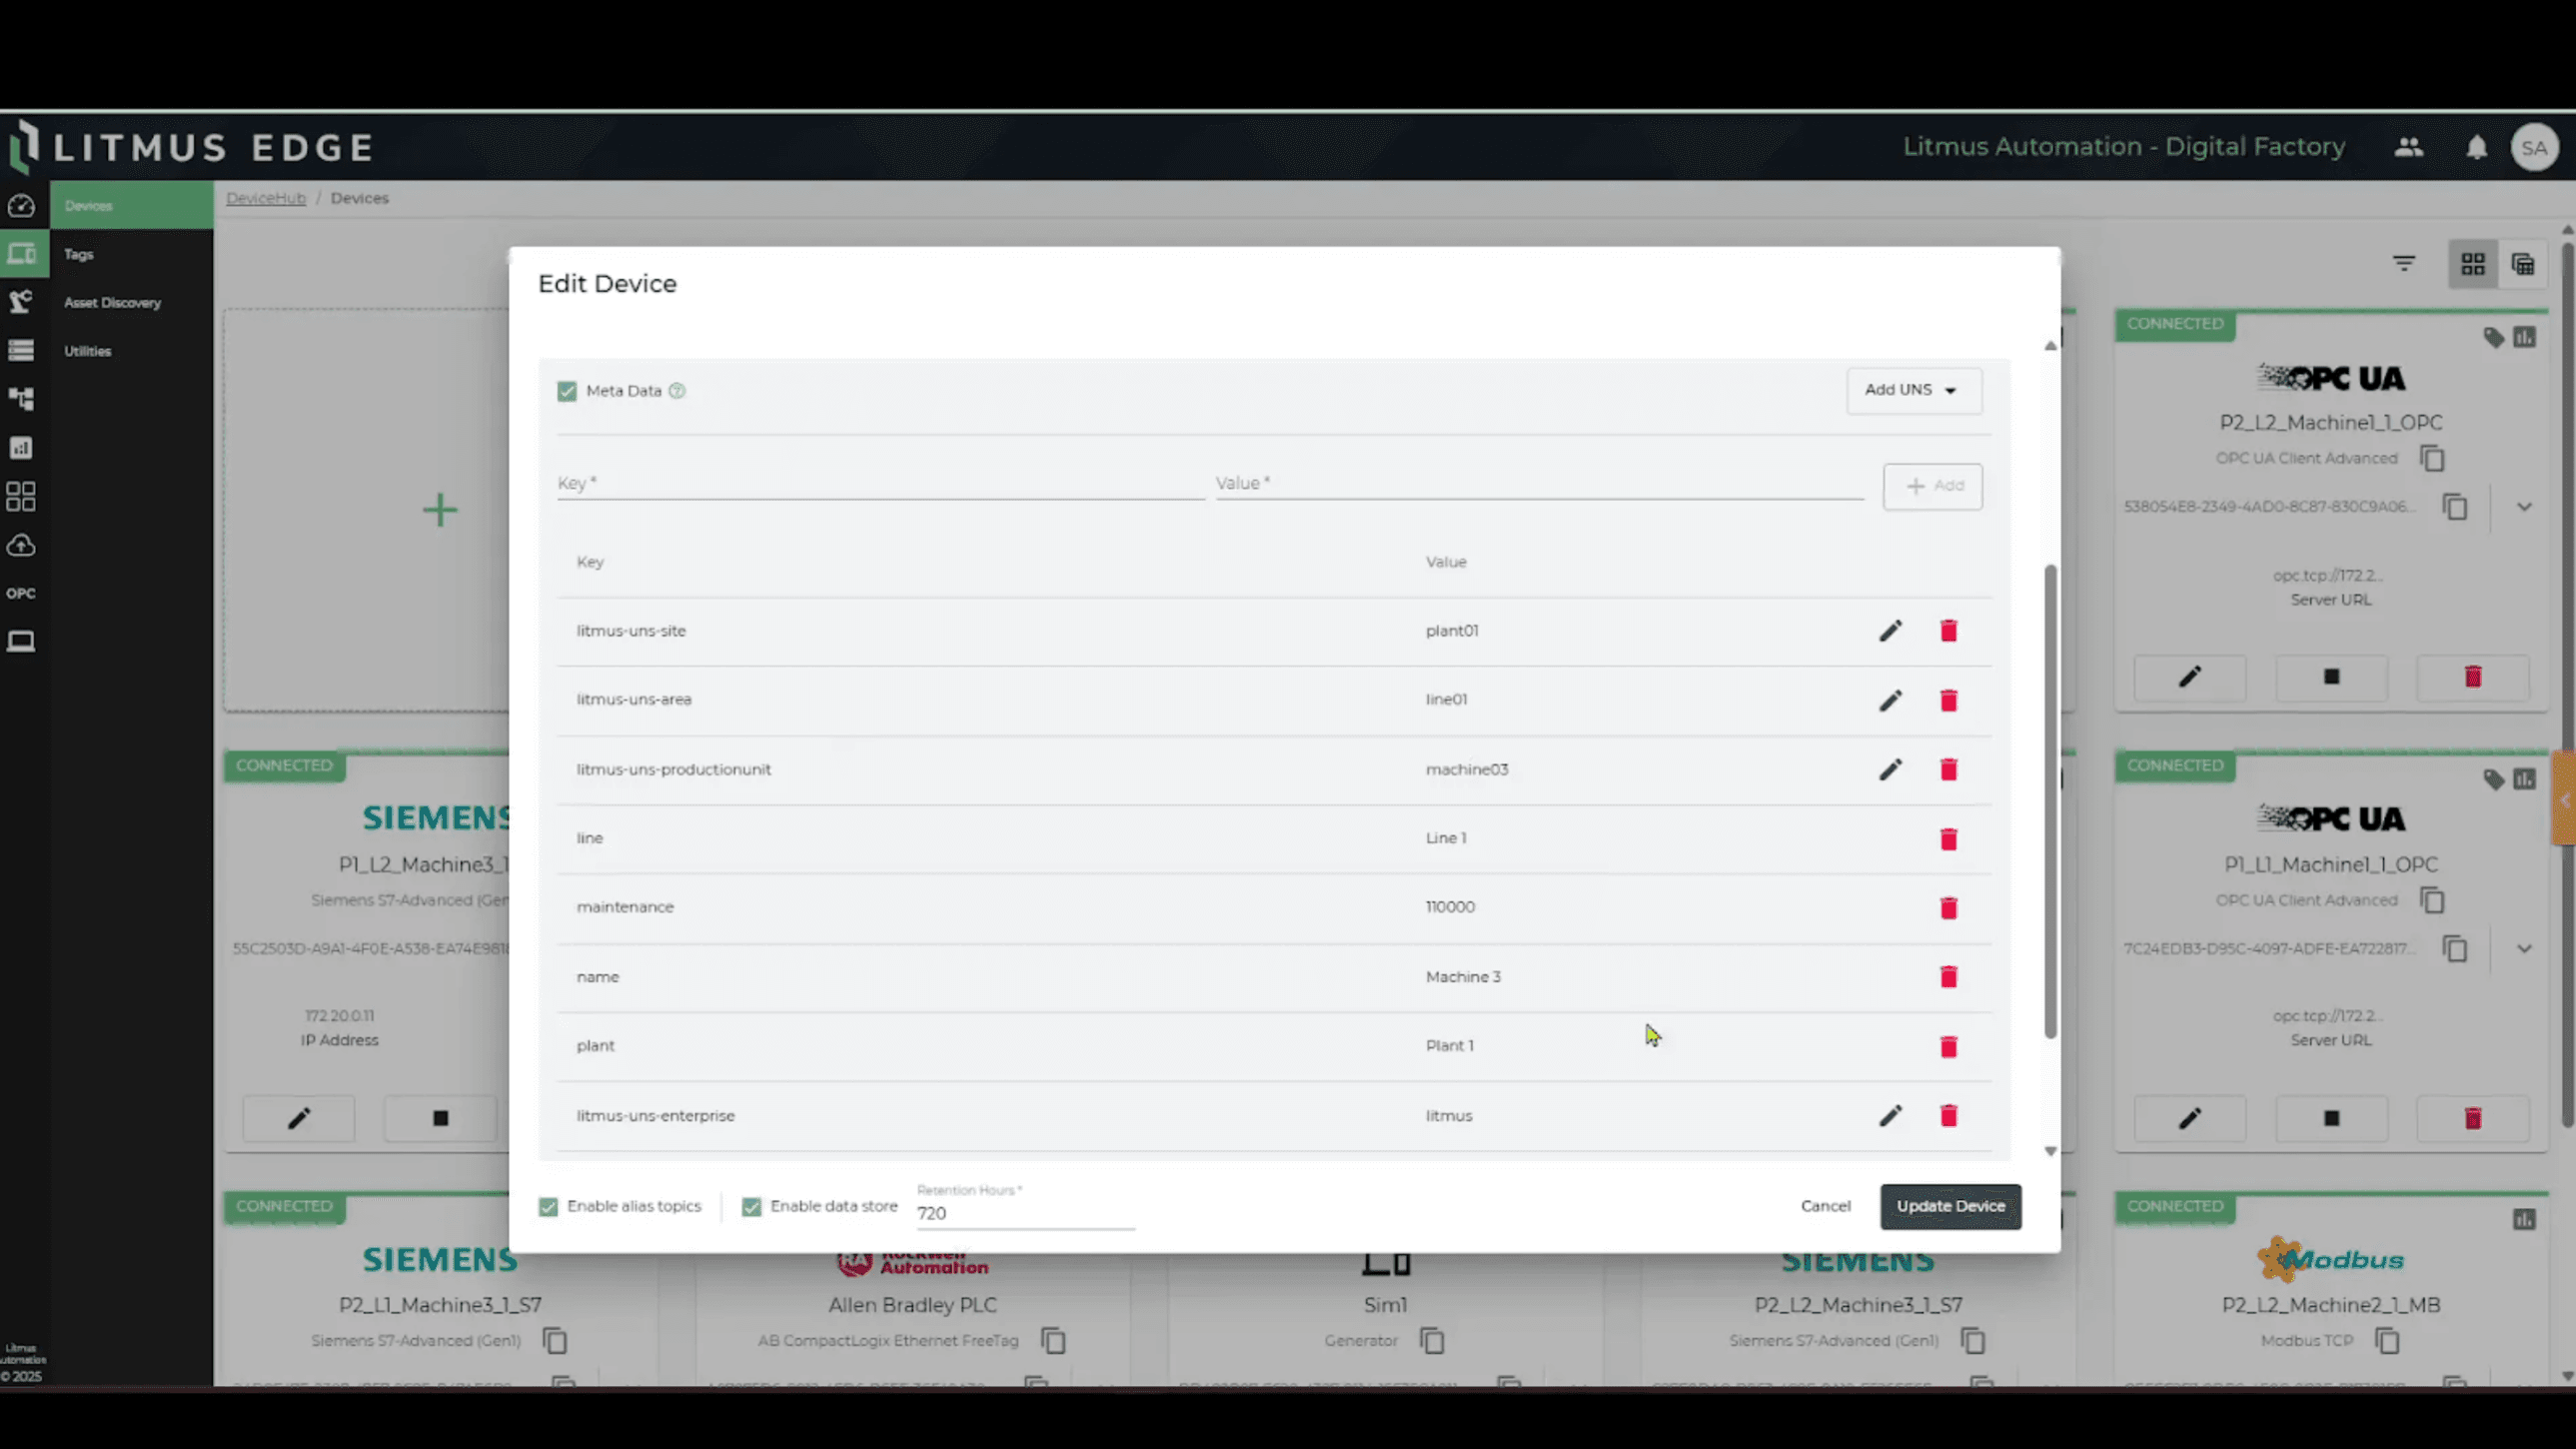
Beyond just connecting devices, the DeviceHub incorporates rich metadata that tells the full story behind each data point. Rich metadata is associated with each device and tag, offering critical context for analytics, machine learning, and visualization tools.
Each device in the demo stores data continuously for up to 7,240 hours (roughly 10 months), providing a deep historical record to support trend analytics, root cause investigation, and predictive maintenance.
This metadata-first approach helps transform raw machine data into actionable intelligence, making insights easier to extract, visualize, and apply.
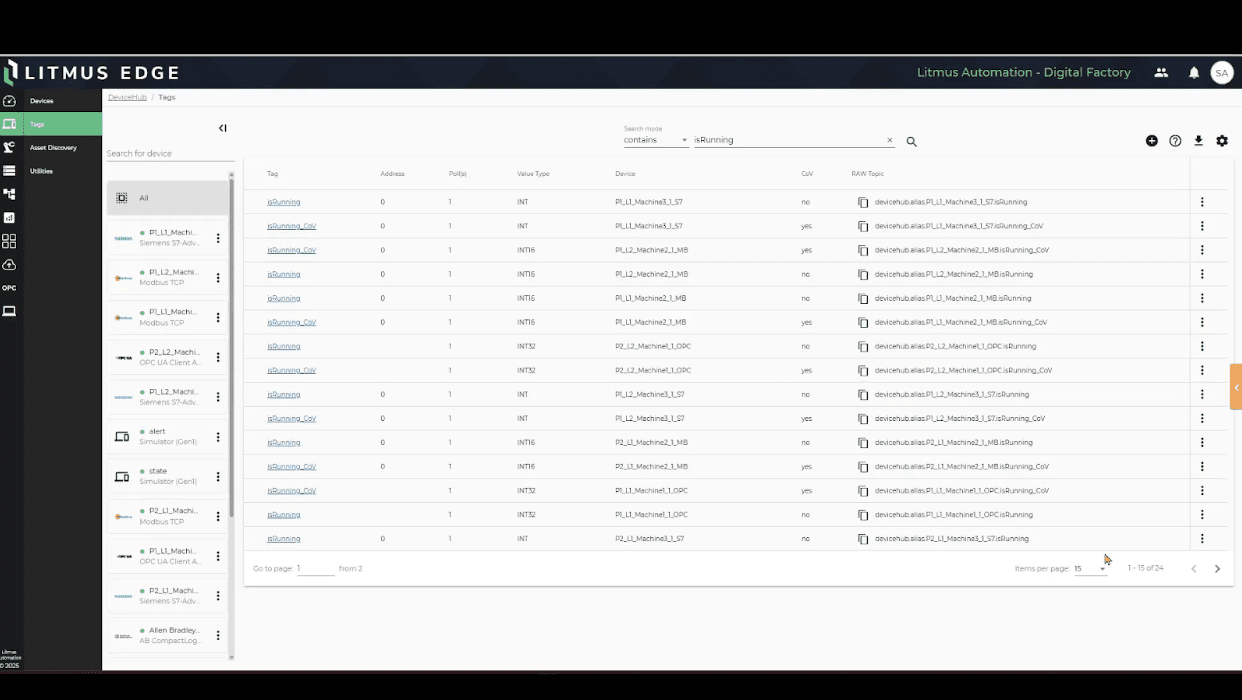
Tags (the units of industrial data pulled from each device) are uniformly managed through templates within the demo. For example, each machine includes standard tags like:
Is running
Is running change of value
Takt time
Pressure
Temperature
This consistency enables users to easily query specific tags across all machines (e.g. show all 24 instances of “is running” across 12 devices) and aggregate data for cross-line and cross-plant analysis.
Standardized tagging accelerates insights and supports plug-and-play analytics, giving teams a structured, scalable way to build dashboards and metrics.
Many tags originate from soft PLCs and include critical operational parameters such as takt time, pressure, and temperature. These metrics provide the foundation for deeper analytics and performance monitoring.
A standout use case in the Digital Factory Demo is the calculation of Overall Equipment Effectiveness (OEE), a foundational KPI in manufacturing that combines:
Performance: (cycle time + takt time) x total items / uptime x 100
Availability: uptime vs downtime
Quality: yield vs scrap
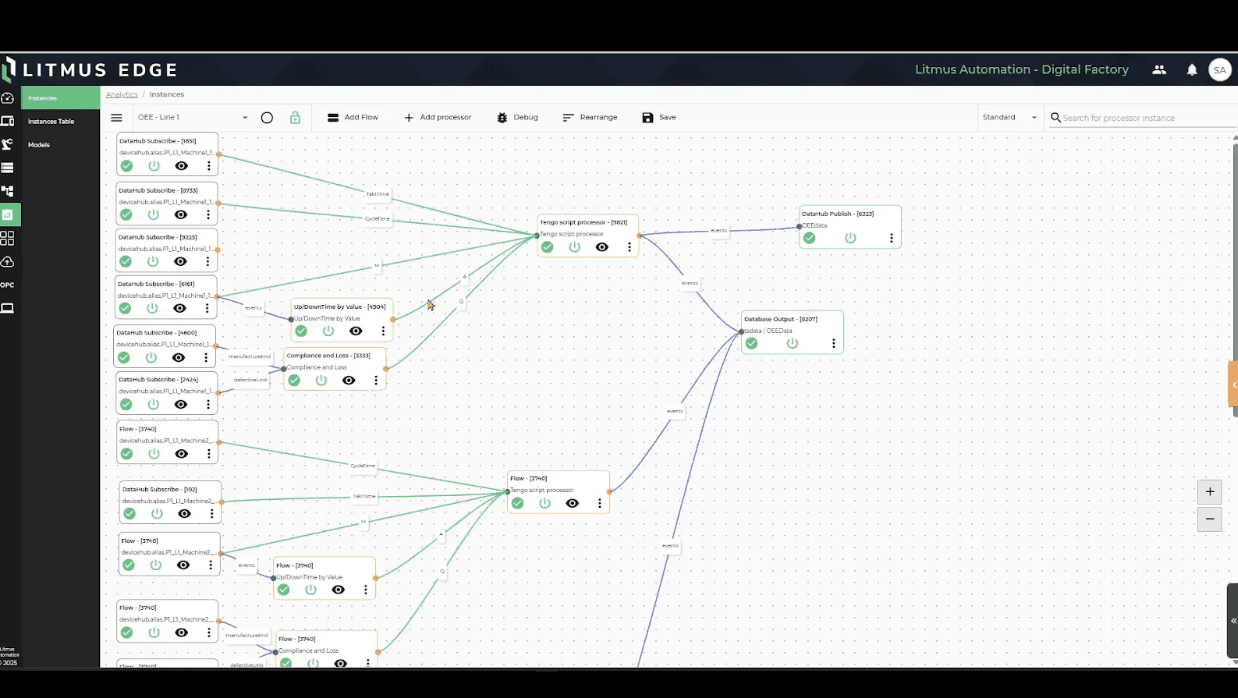
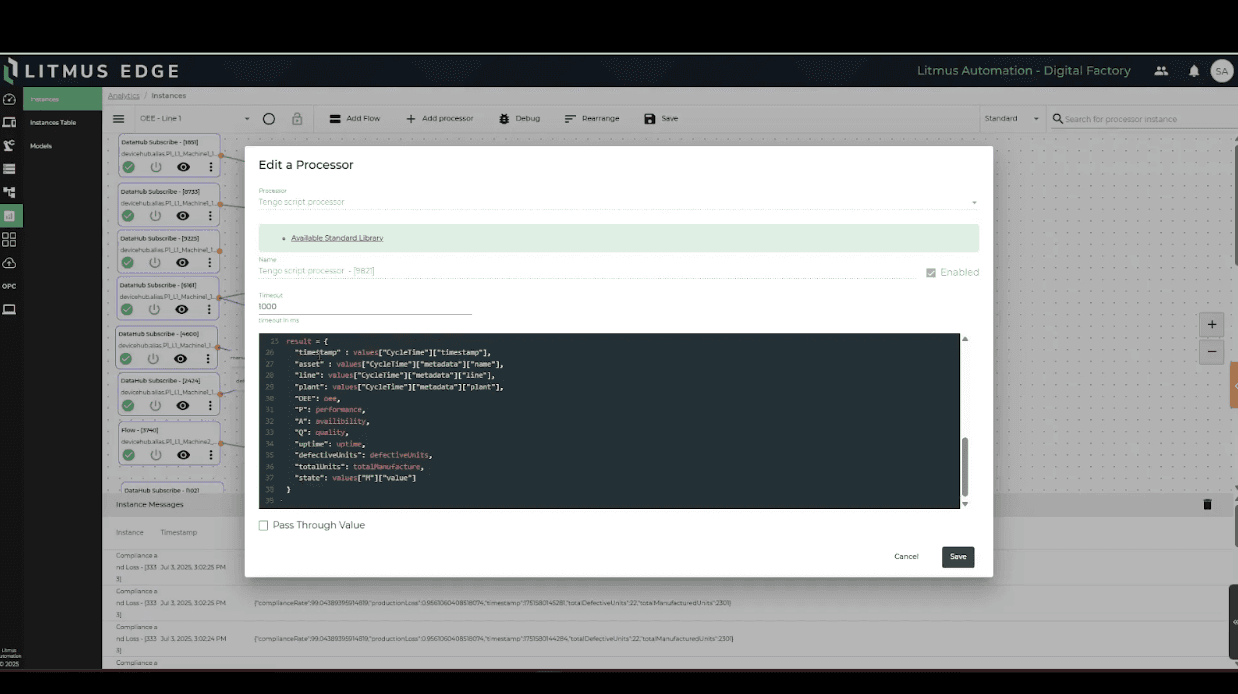
These calculations are powered by Tengo scripting—a lightweight, efficient scripting engine built into Litmus Edge. The script ingests data like uptime and cycle time, performs basic arithmetic, and publishes a JSON payload into a time-series database, all in real time.
- 1.
Real-time data like uptime, cycle time, and takt time flows into the script.
- 2.
The script reads specific device wires and keys to extract the relevant values.
- 3.
It then performs simple arithmetic operations to calculate performance, availability, and quality.
- 4.
The computed OEE value is packaged into a JSON payload
- 5.
That payload is then published to a time-series database under the “OEE measurement” category.
This lightweight scripting means you can perform complex, multi-factor calculations using just a few lines of code, enabling real-time visibility into operational performance and faster, smarter decisions on the factory floor.
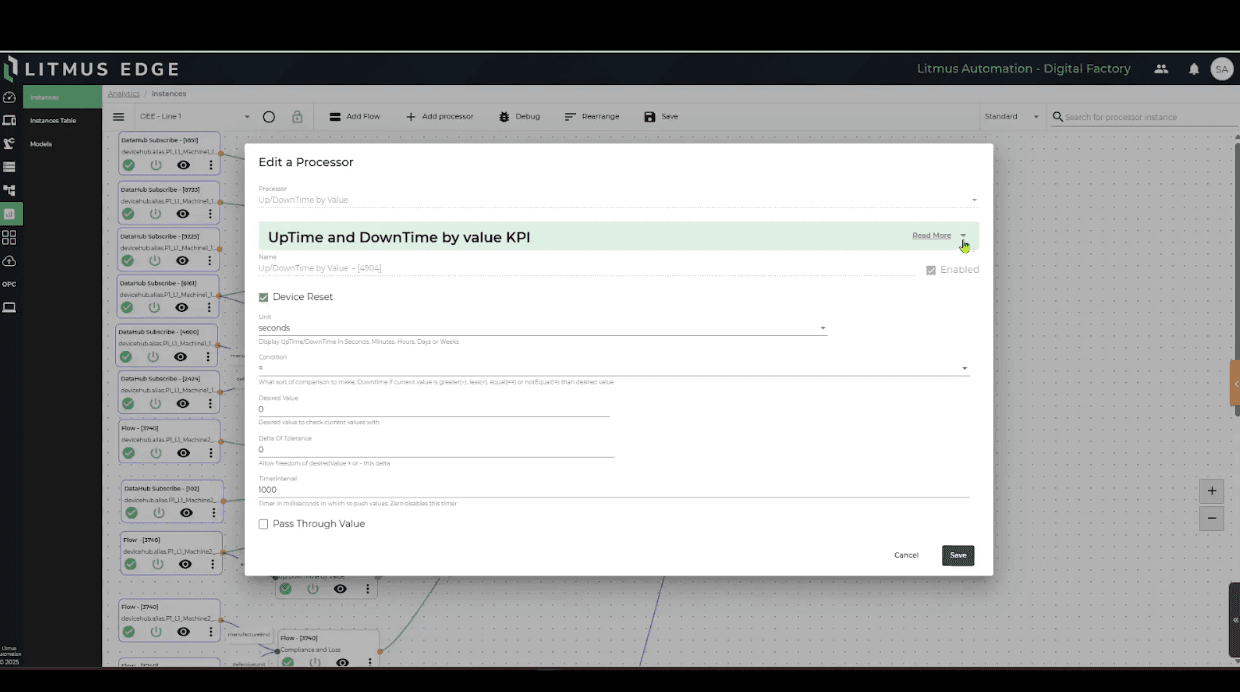
In total, the platform offers access to 40+ KPIs, enabling users to model and monitor key metrics using fill-in-the-blank message formats and moving averages, without coding required.
In addition to descriptive analytics, the Digital Factory Demo includes predictive and preventative maintenance modules. These tools analyze historical trends, detect anomalies, and surface early warnings before failures occur.
By anticipating potential breakdowns and automating maintenance schedules, these capabilities help reduce unplanned downtime and extend the life of equipment, further demonstrating how Litmus turns raw data into operational excellence.
Most platforms talk about speed and scale. Litmus shows it in under five minutes. No other industrial edge platform can spin up a complete, contextualized, production-ready environment this fast.
The Digital Factory Demo isn’t just a technical showpiece—it’s a strategic enabler that helps teams:
Align stakeholders around real IIoT use cases
De-risk proof-of-concept deployments
Accelerate buying decisions with clear technical evidence
Give partners a repeatable, reliable way to demonstrate value
From device connectivity to advanced analytics, Litmus showcases the end-to-end capabilities of its edge data platform—all without requiring a single physical machine.
Whether you’re evaluating Litmus for your operations or you’re a partner looking to demo at scale, the Digital Factory Demo gives you everything you need to show off Litmus Edge—fast.
Want to see it for yourself? Talk to our team to get access and start your demo. Already a Litmus customer? Connect with your Customer Success Manager to enable the Digital Factory Demo today.