
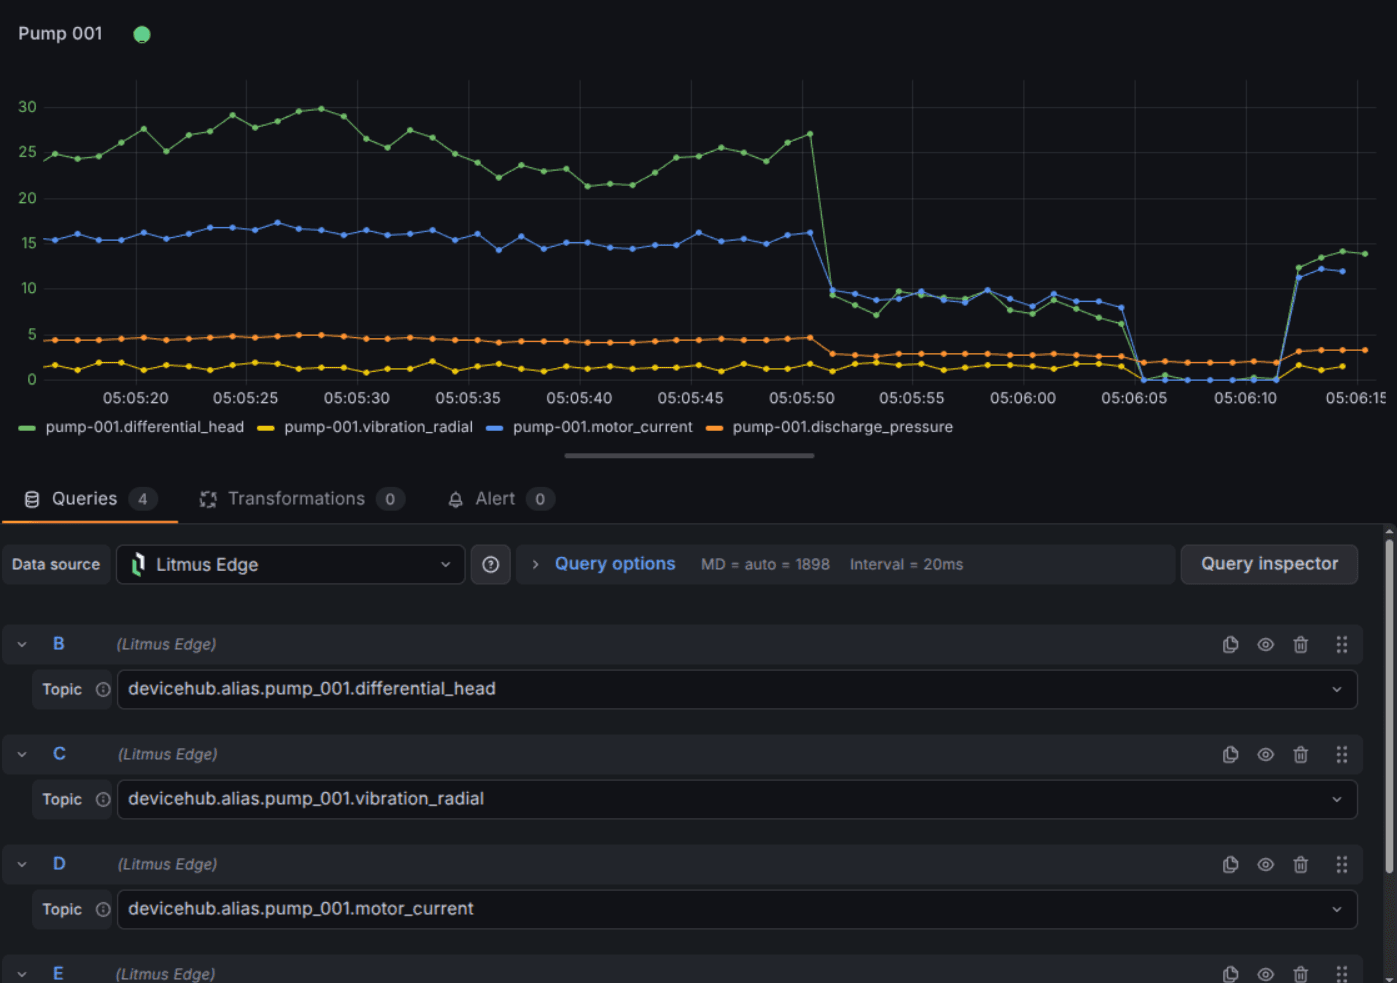
Litmus Grafana streams live Litmus Edge data into Grafana dashboards. It has two parts. The Litmus Edge data source plugin subscribes to NATS topics on Litmus Edge and pushes the data to panels once per second. The litmus-grafana Docker image is Grafana with that plugin and extra visualization plugins already installed and configured. To add the plugin to an existing Grafana v12.2 or later, download the plugin zip from this page and follow the installation guide. To start a new Grafana with everything preinstalled, pull the image litmusedge.azurecr.io/litmus-grafana:latest from the registry. Both require Litmus Edge v3.16 or later. The plugin shows live data only and does not store history. The documentation has the full guide.

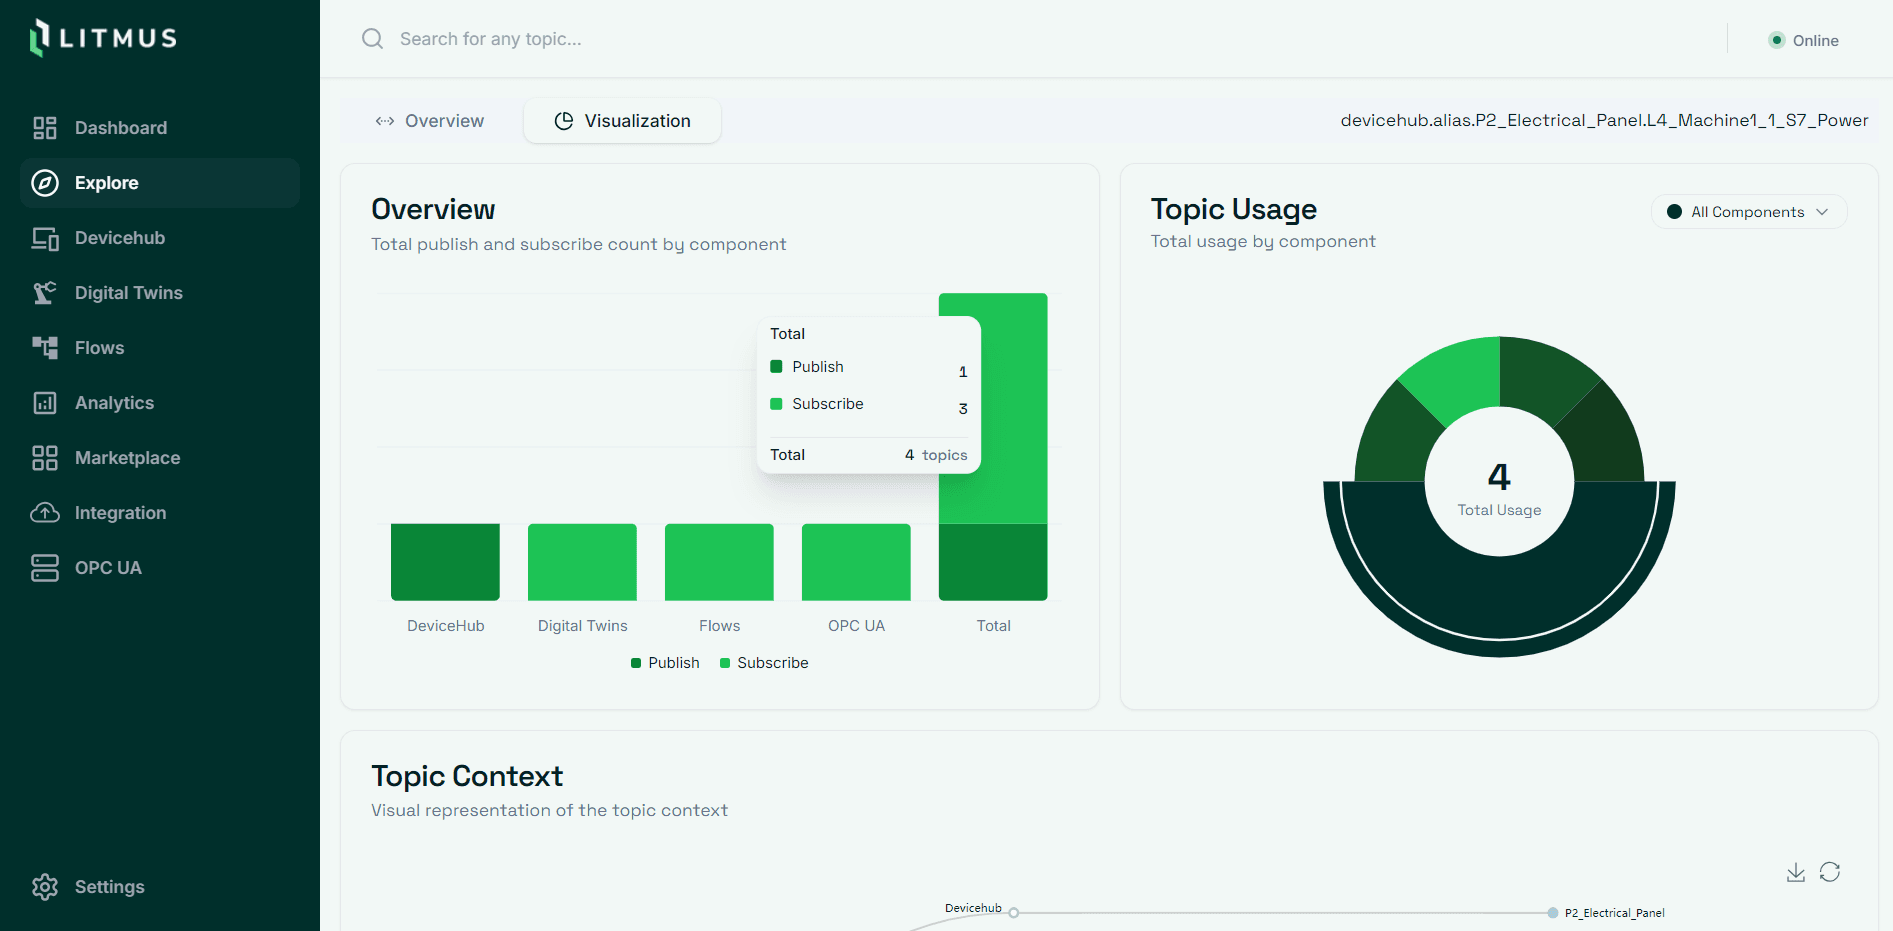

Trace Litmus Edge data flows with searchable topic relationships and live values.