A guide to connect LEM with a Syslog server.
Litmus has covered monitoring using Prometheus along with Grafana in this guide.
However, monitoring is incomplete without alerting. That’s why in this guide we will cover the topic of alerting using the Prometheus Alert Manager integrated.
Prometheus Alert Manager handles alerts sent by Prometheus server and notifies end user through E-mail, Slack or other tools.
Prometheus Alert Manager is the open source standard for translating alerts send by Prometheus into alert notifications for your engineering teams to make them actionable. It can notify end user through E-mail, Slack or other tools.
Monitoring helps predict potential problems and notify about current problems in a Litmus Edge Manager environment and gives detail regarding the problem. Alerting helps notify as soon as the problem occurs and allows teams to identify the problem through notifications.
As users are able to create through this approach actionable Alerts, this can help with Alert Fatigue.
Alert Fatigue is the exhaustion due to frequently responding to unprioritized and unactionable alerts. This is unsustainable in the long run. Not every alert is so urgent that it should wake up a support engineer.
To ensure that an on-call week is sustainable several aspects should be considered.
For support the focus is often on response time and how long a resolution takes but how do they know the on-call process is not contributing to burn out?
As Prometheus Alert Manager does challenge the assumption that a dozen alerts should result in a dozen alert notifications it adresses a series of typical support related pain points causing unsustainable and inefficient support.
Pain Point: Send alerts to the right team
Feature: Routing
Prometheus Alert Manager: Labelled alerts are routed to the corresponding receiver
Pain Point: Too many alerts at once
Feature: Inhibition
Prometheus Alert Manager: Alerts can inhibit other alerts (e.g., Litmus Edge down alert inhibits DeviceHub down alert)
Pain Point: False positive on an Alert
Feature: Silencing
Prometheus Alert Manager: Temporarily silence an alert, especially when performing scheduled maintenance
Pain Point: Alerts are too frequent
Feature: Throttling
Prometheus Alert Manager: Customizable back-off options to avoid re-notifying too frequently
Pain Point: Unorganized alerts
Feature: Grouping
Prometheus Alert Manager: Logically group alerts by labels such as ‘environment=dev’ or ‘service=broker’
Pain Point: Notifications are unstructured
Feature: Notification Template
Prometheus Alert Manager: Standardize alerts to a template so that alerts are structured across services
By leveraging these features of Prometheus Alert Manager, dozens of alerts can be distilled into a handful of alert notifications, allowing on-call engineers to context switch less by thinking in terms of incidents rather than alerts.
Litmus Edge Manager does include by default Alerts using Prometheus Alert Manager, to bring these vital features to your organization allowing our customers to efficiently and sustainably support their Litmus Environment.
But if your organization does make use of an existing centralized Prometheus Alert Manager or solutions such as offered by Sysdig, Litmus Edge Manager can easily be connected to this platform and become part of your overall IT infrastructure support strategy.
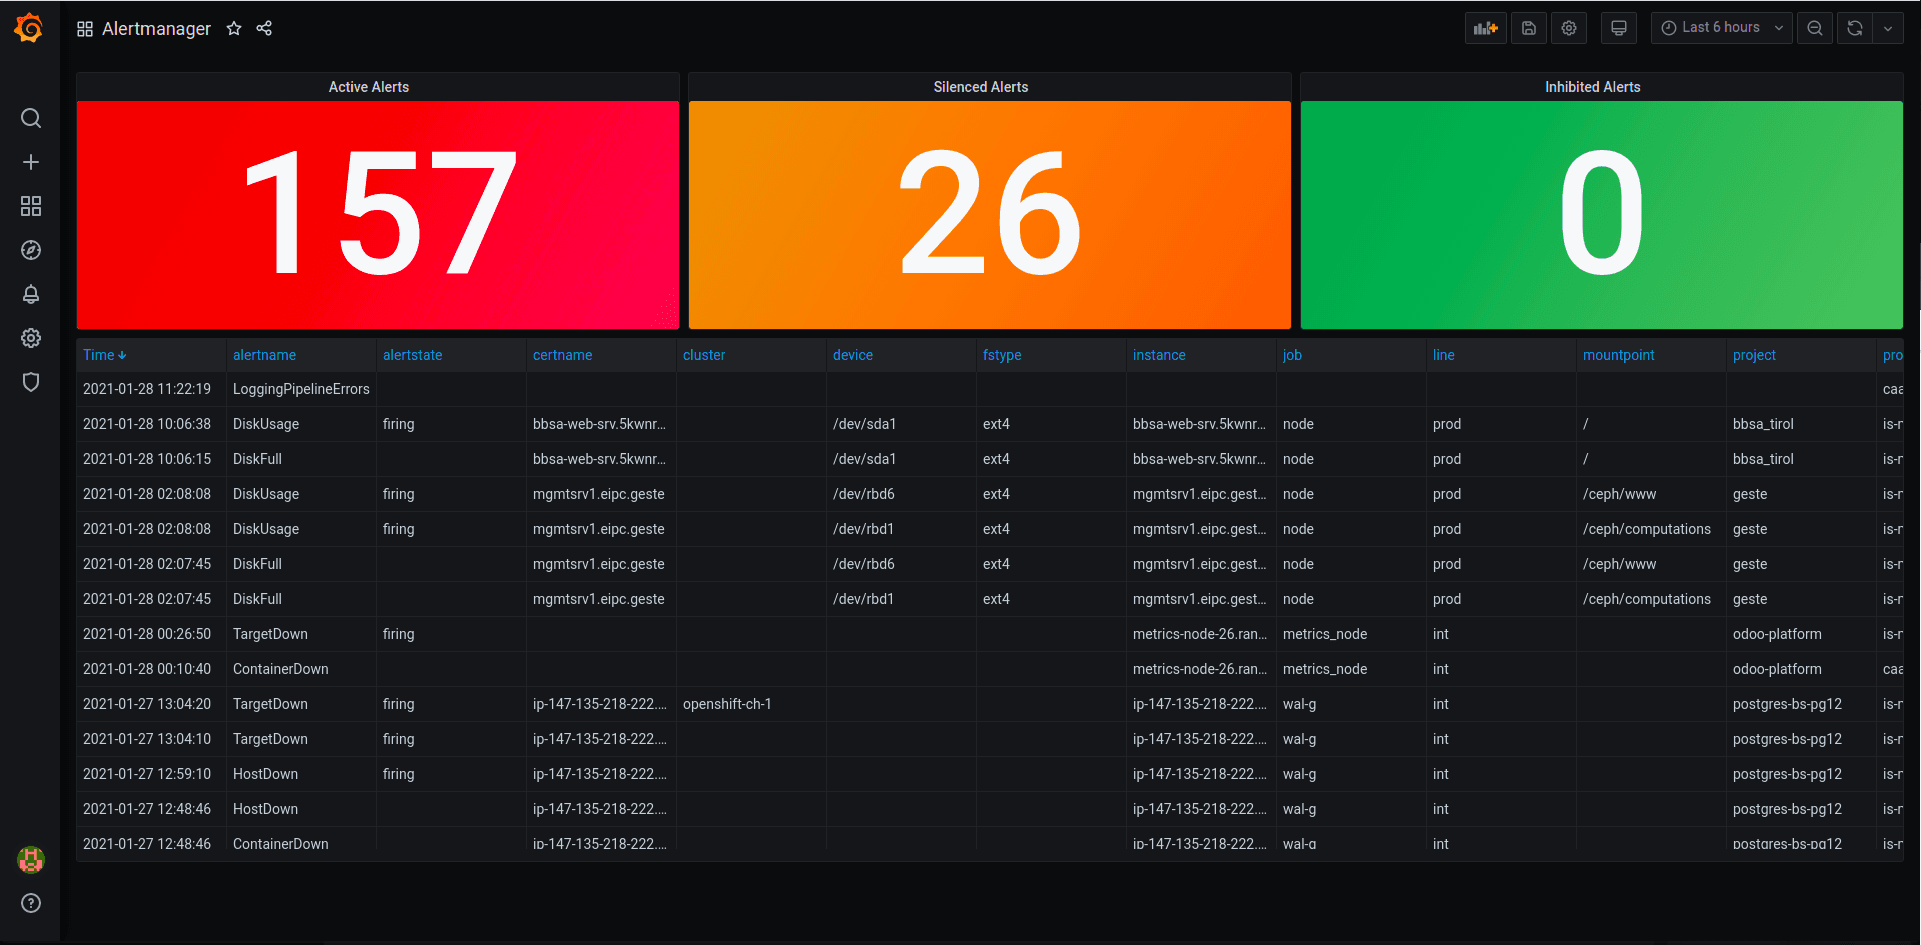
It is also possible to visualize Alerts collect by Prometheus Alert Manager with tools such as Grafana using the Prometheus Alert Manager plugin which is not part of this guide.