litmus-datahub-explorer-logo-512
Litmus DataHub Explorer

A web UI for looking inside the DataHub (NATS) broker on a Litmus Edge device: watch messages live, browse tags, inspect payloads and chart values.

v1.0.1

Wie es funktioniert

What it is

Litmus DataHub Explorer is a browser-based window into the DataHub, the NATS message broker inside every Litmus Edge device. Point it at a device, paste the device's API key, and every message on the broker starts streaming into the page.

What you can do

  • Browse every subject in a live tree with per-subject message counts and rates
  • See all tags at once in a sortable, filterable table with current value, type, rate and last-seen time
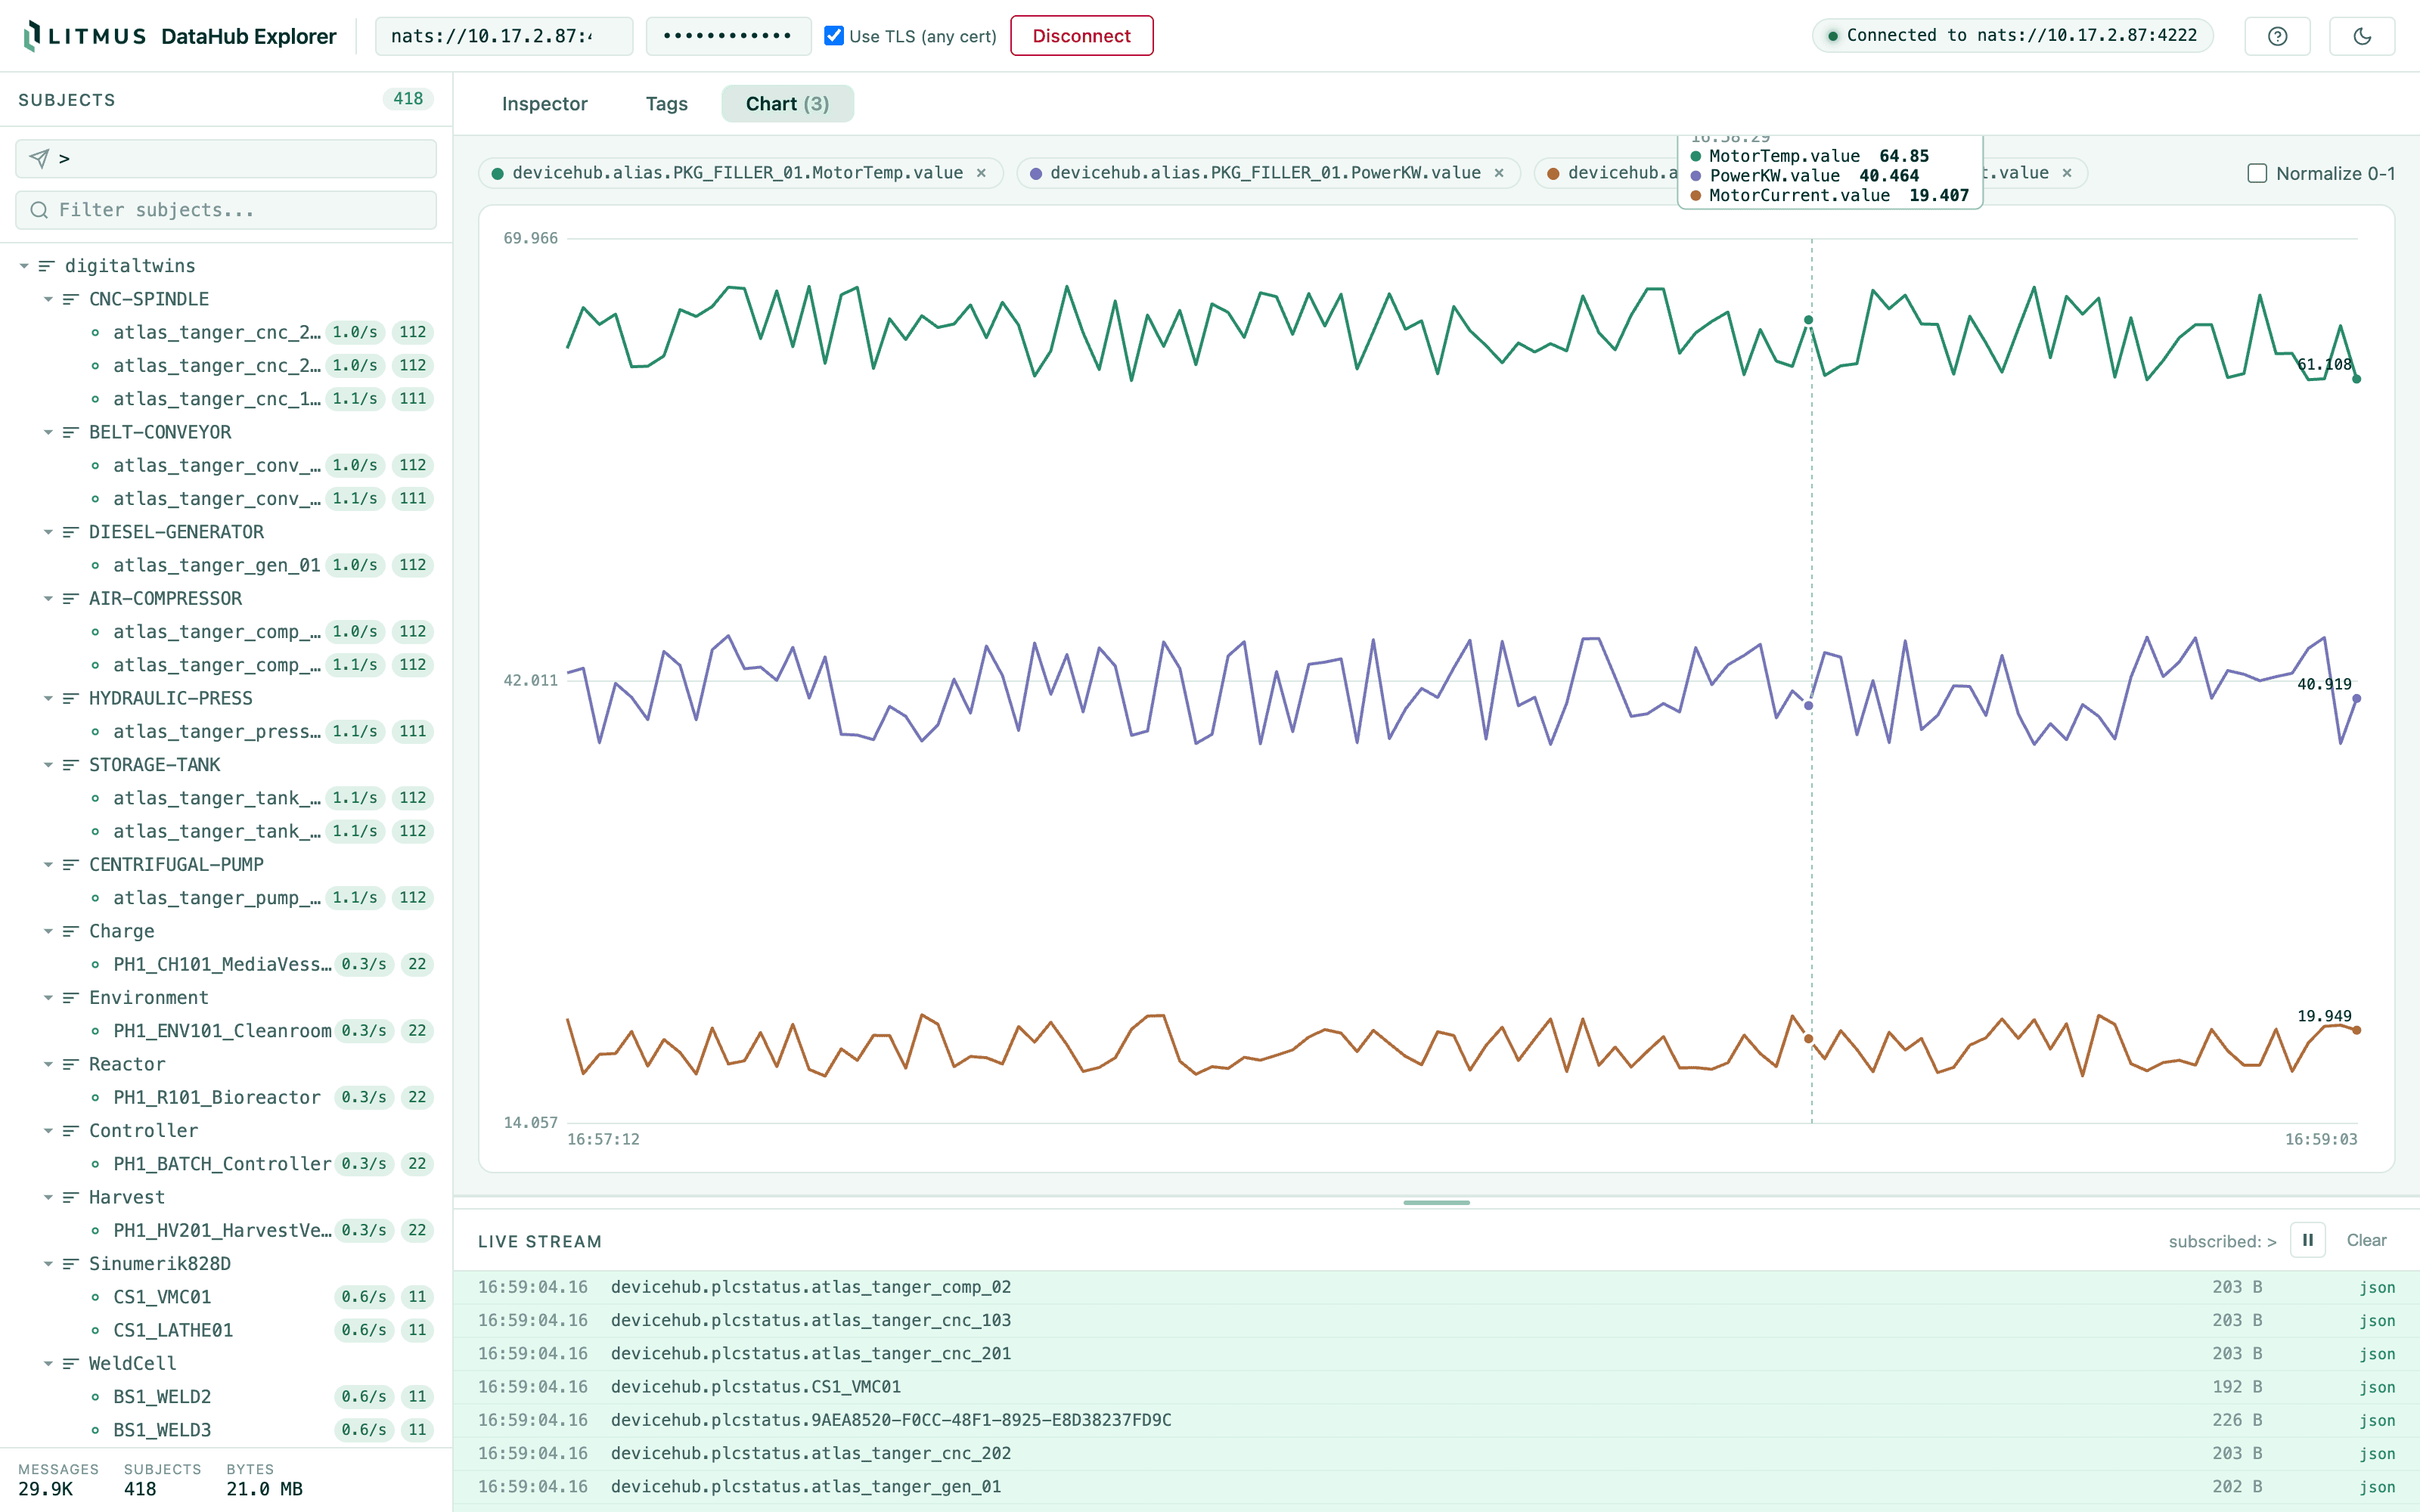
  • Chart values live: pin up to four numeric fields and watch them plot, with a crosshair and a normalize option for mixed scales
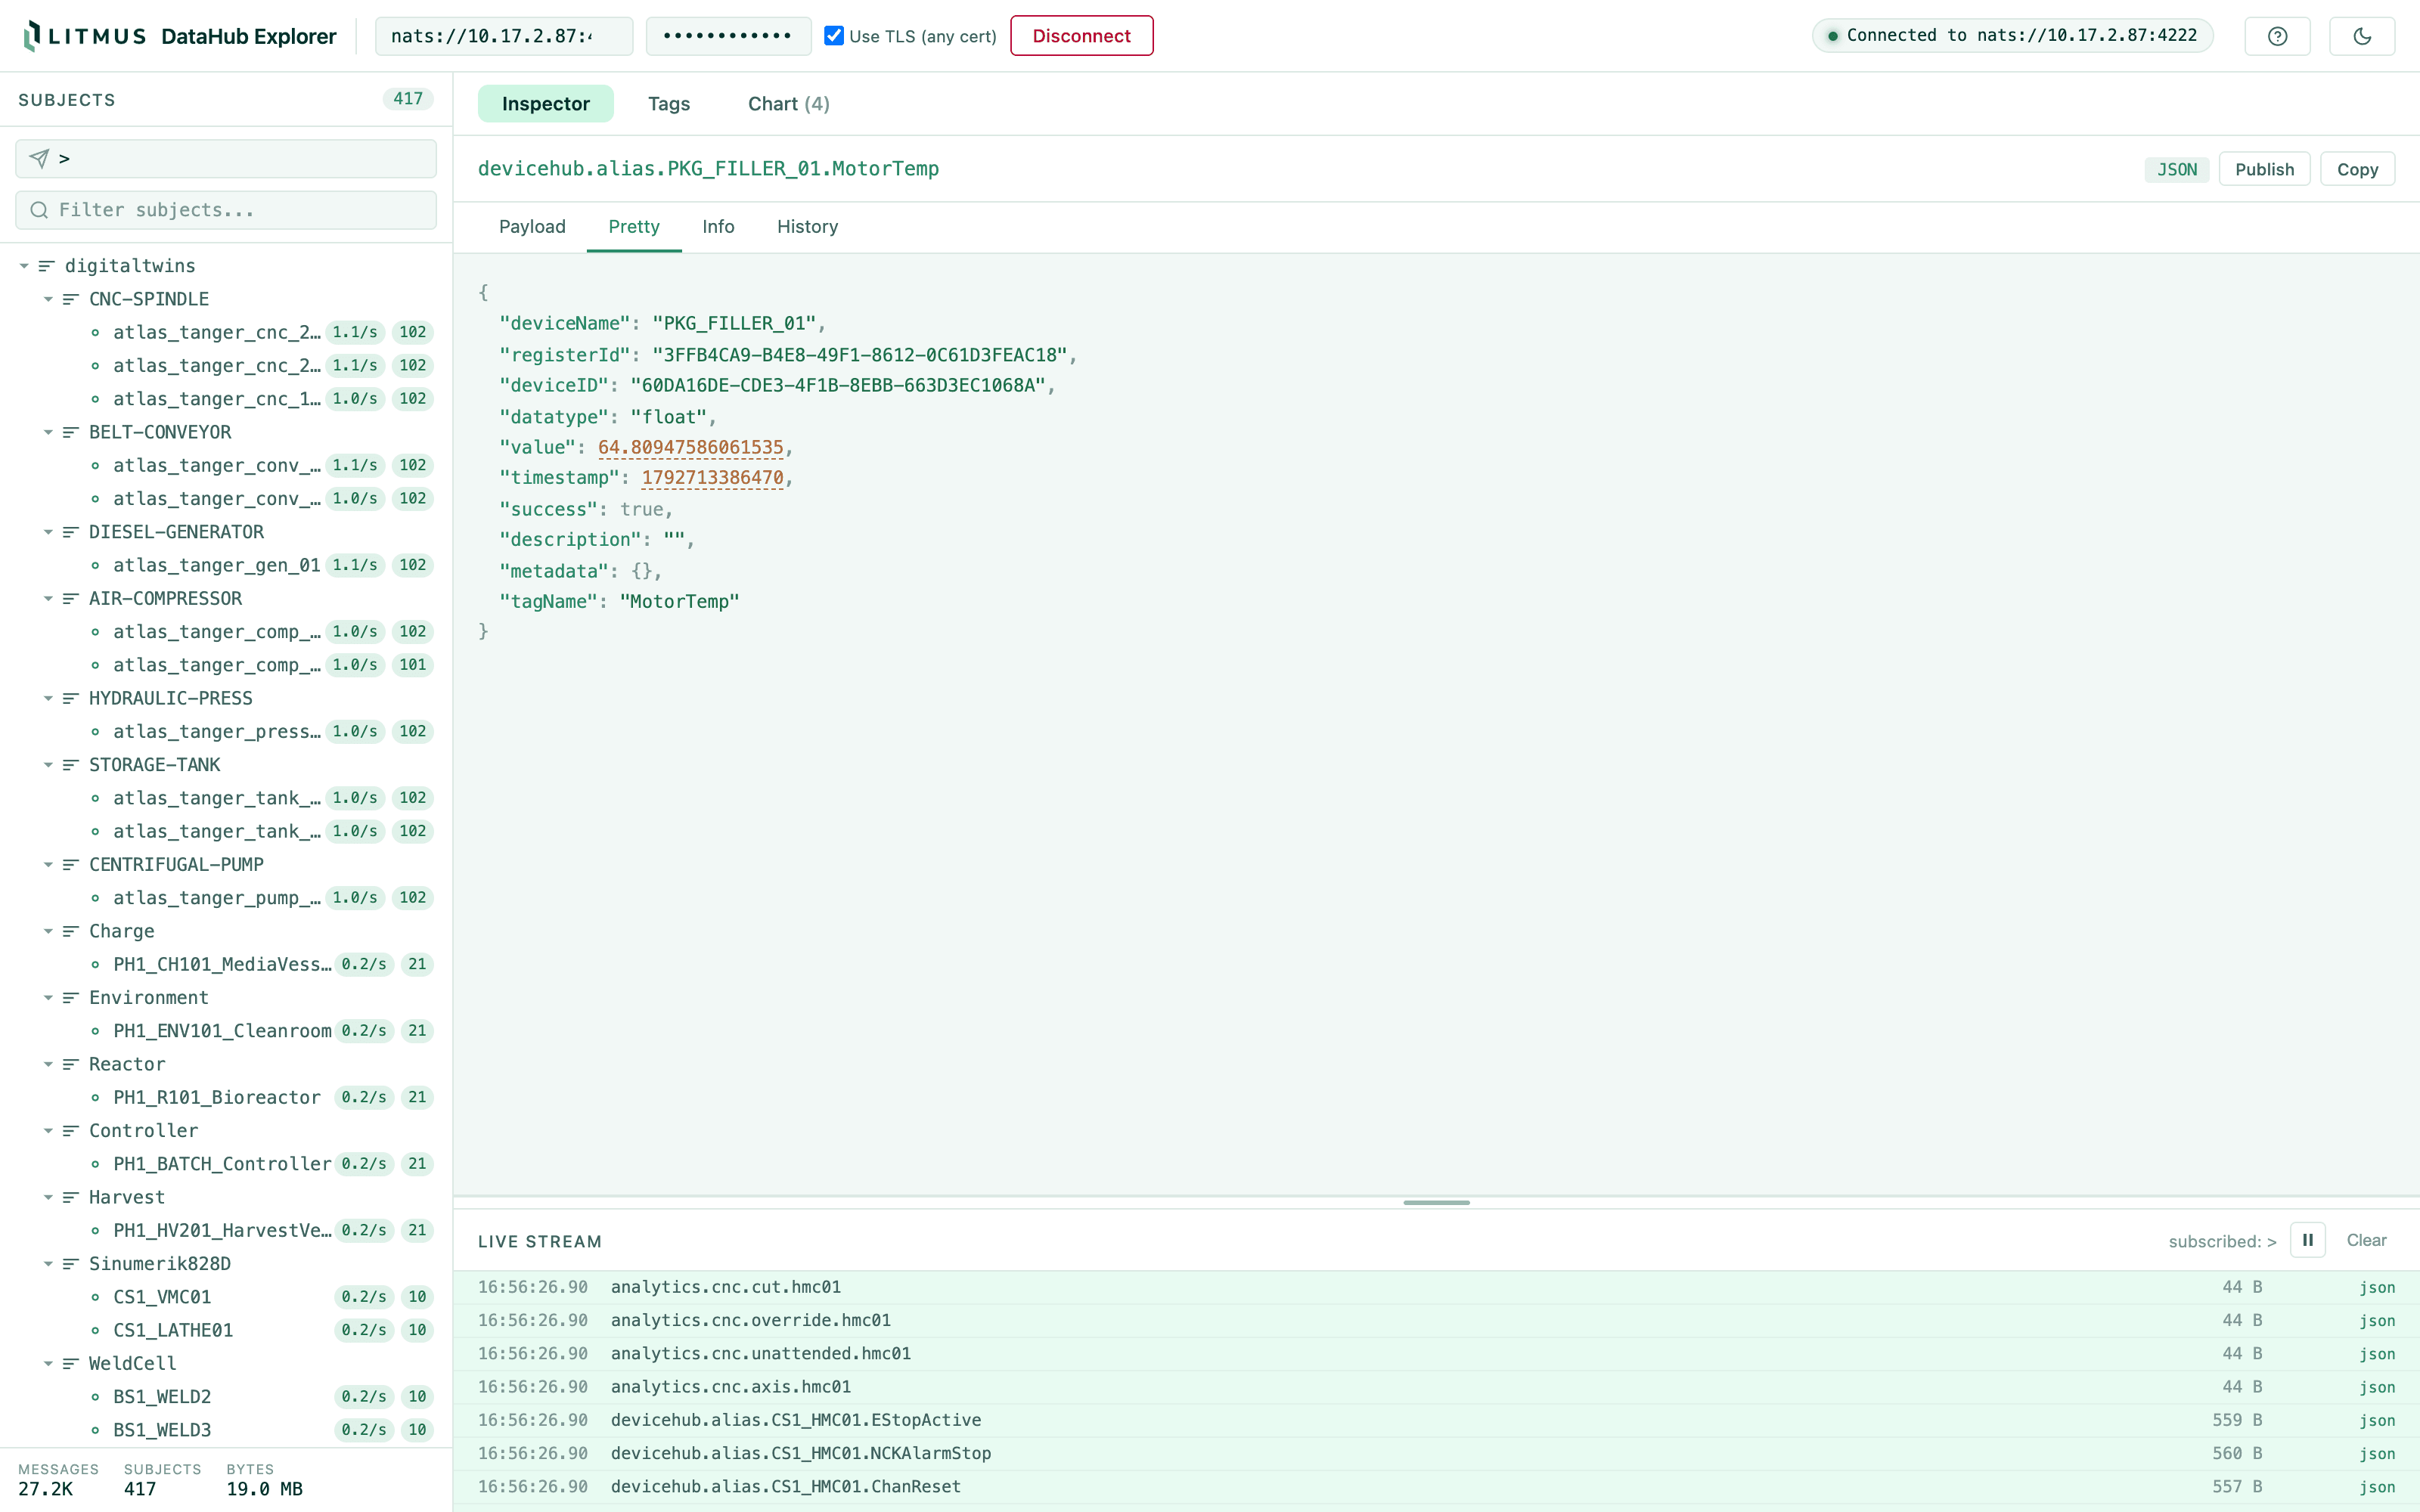
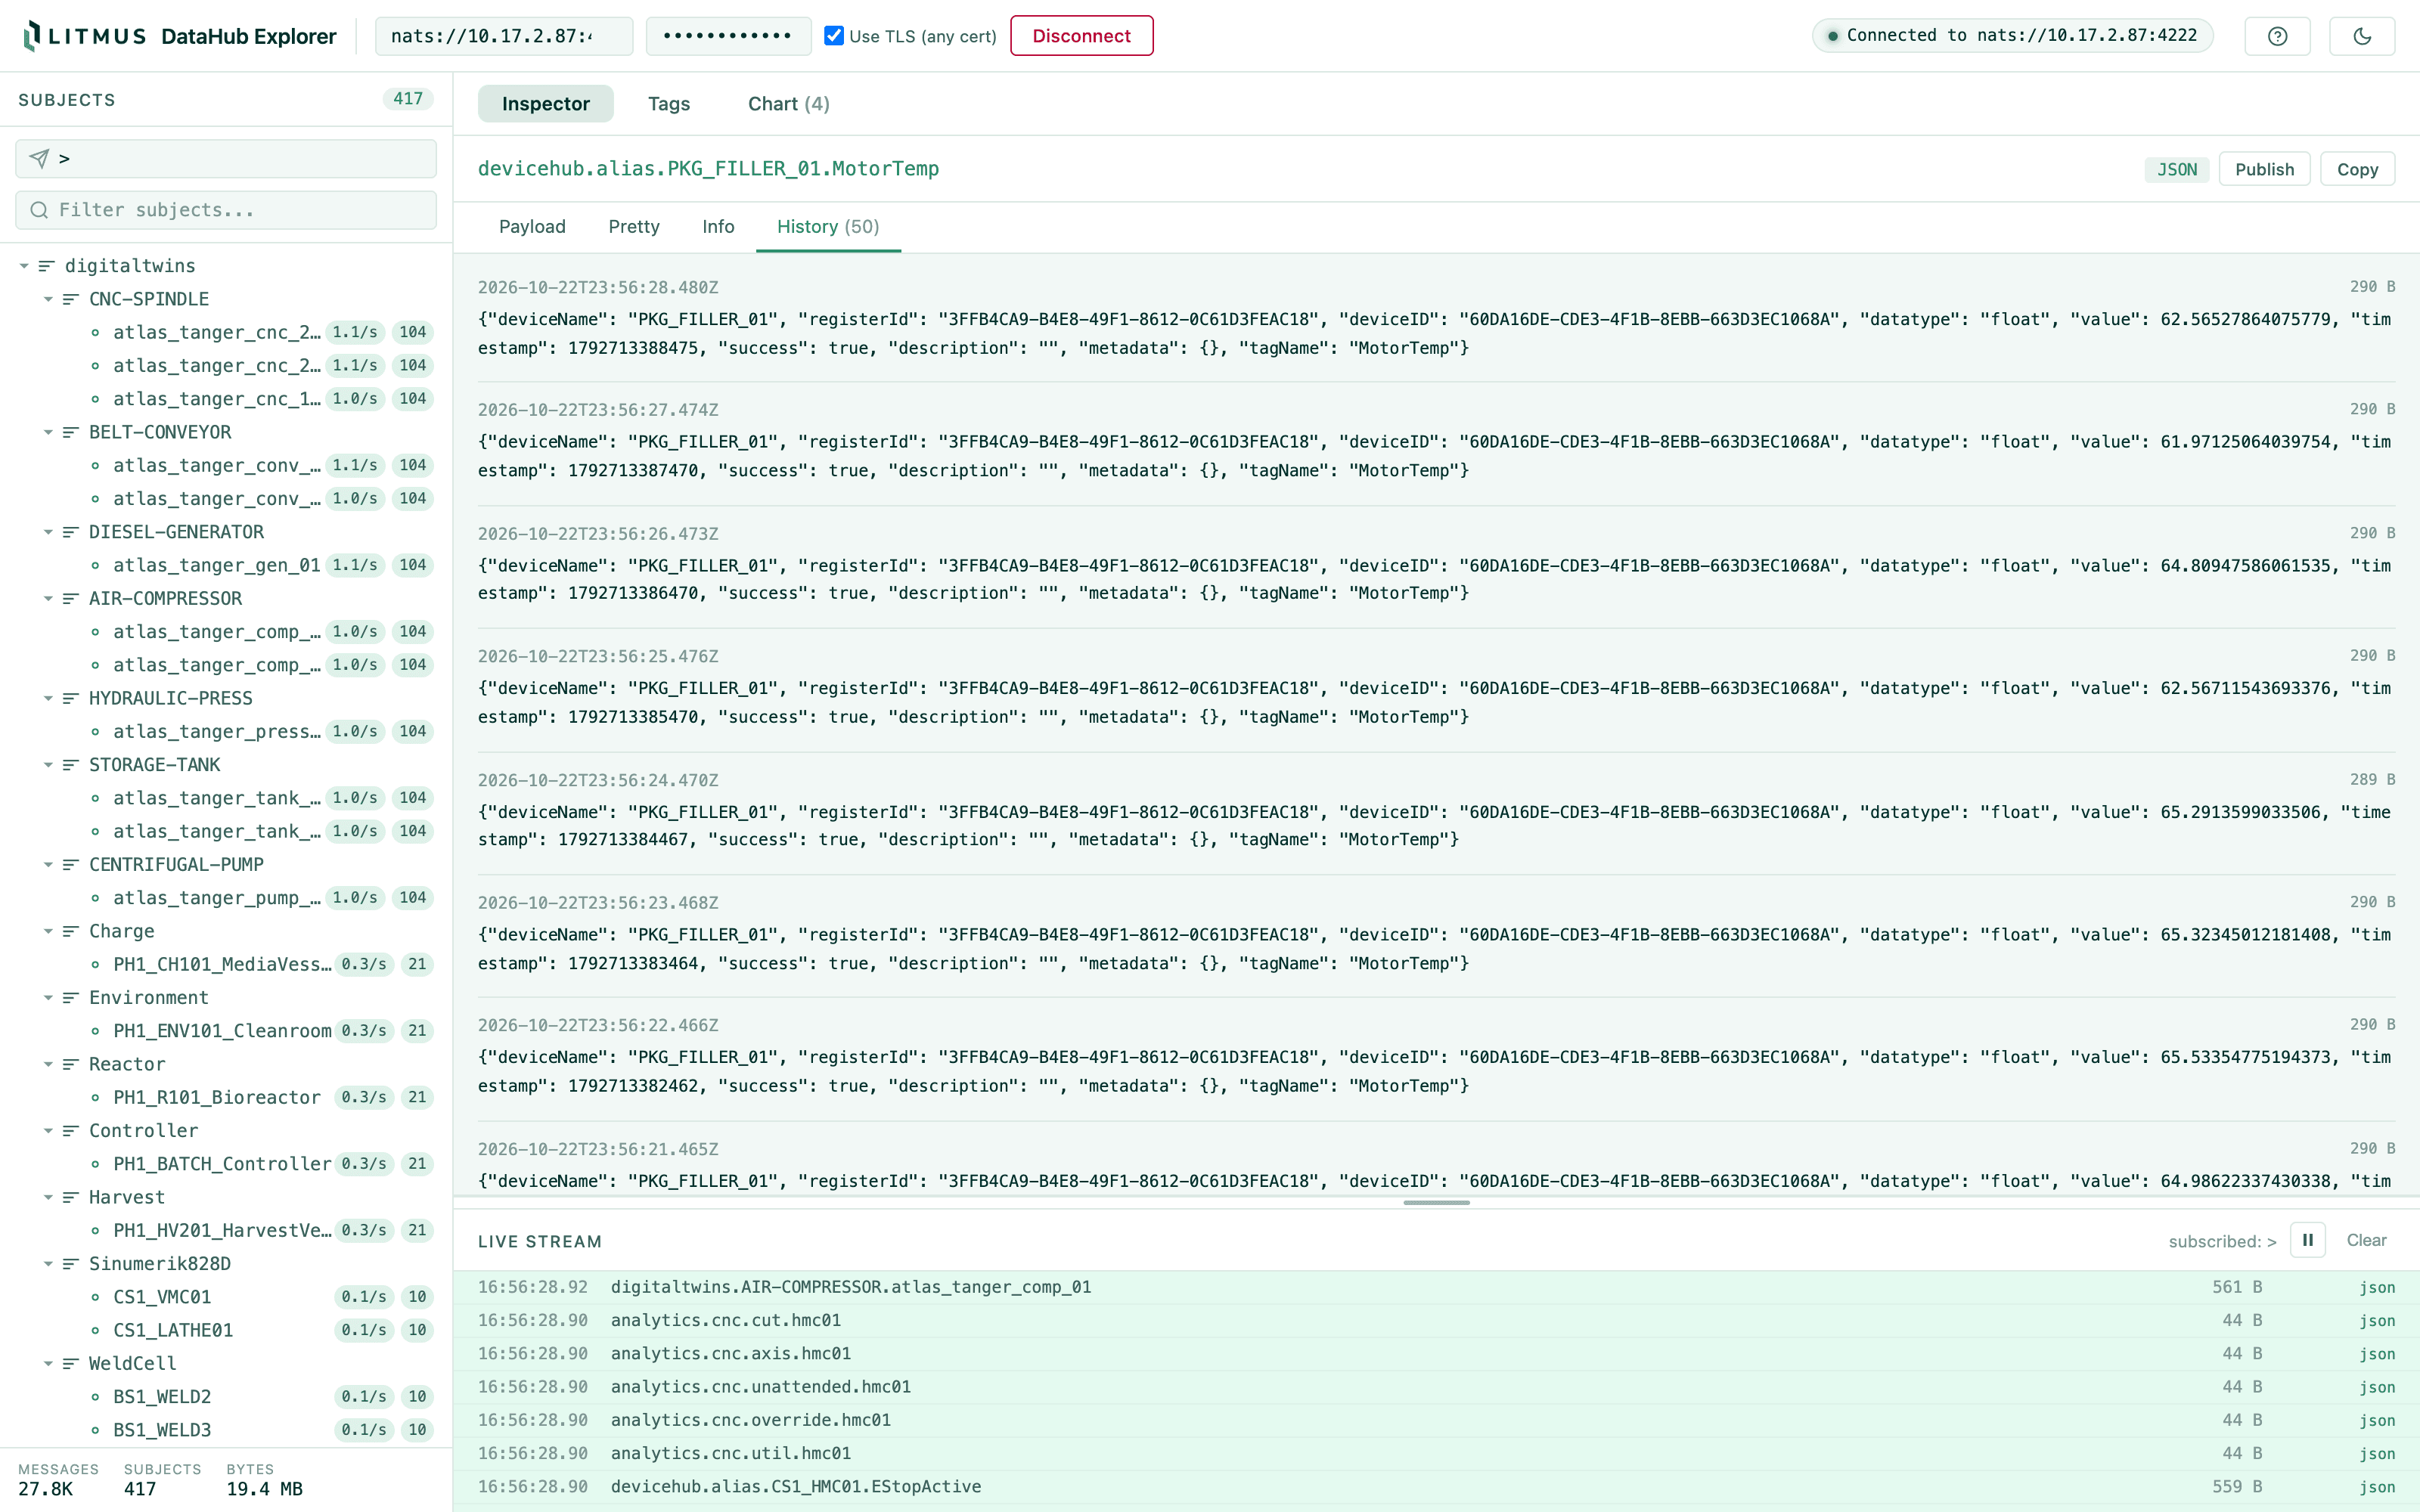
  • Inspect payloads as raw text, pretty JSON or metadata, with per-subject history
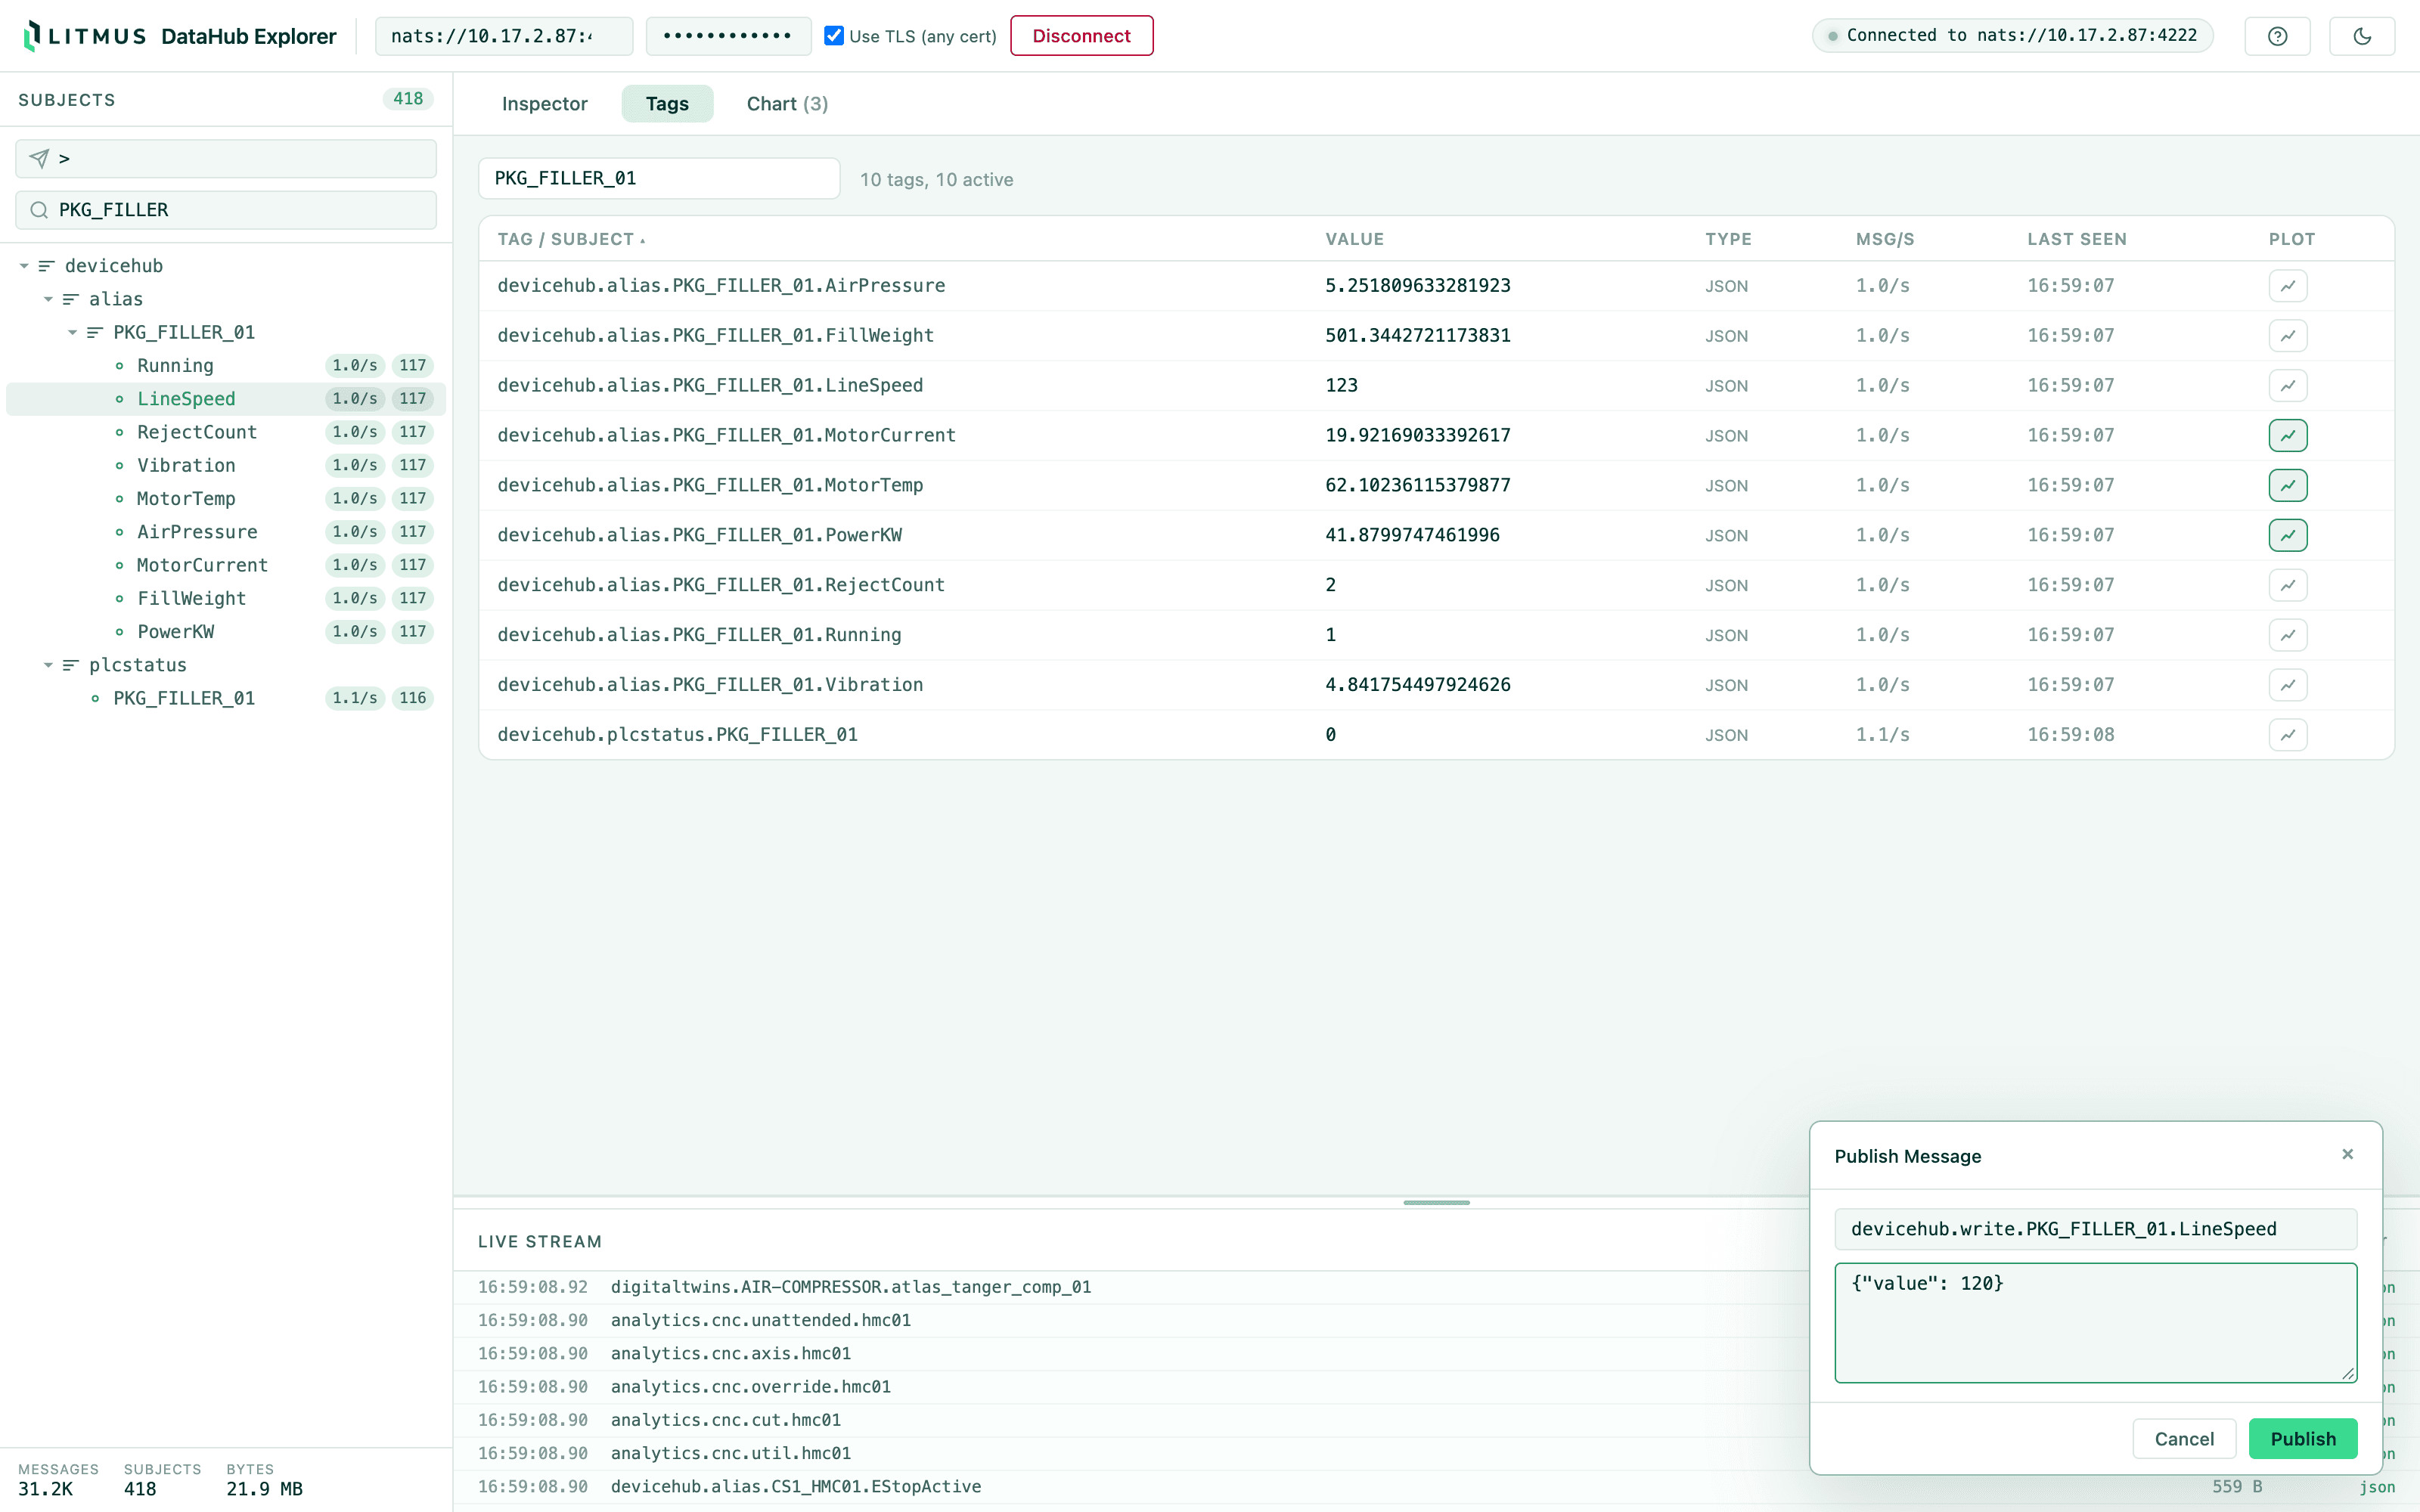
  • Publish test messages to any subject, or lock the UI to read-only
  • Light and dark themes following the Litmus design system

Built for the edge

It runs as a single Docker container on the Litmus Edge device itself or on any machine that can reach it. It serves HTTPS out of the box, can require a login token, and stays responsive under heavy message rates by sampling payload detail while keeping counts exact. Connection details such as Litmus Edge's authentication style and self-signed broker certificates are negotiated automatically.
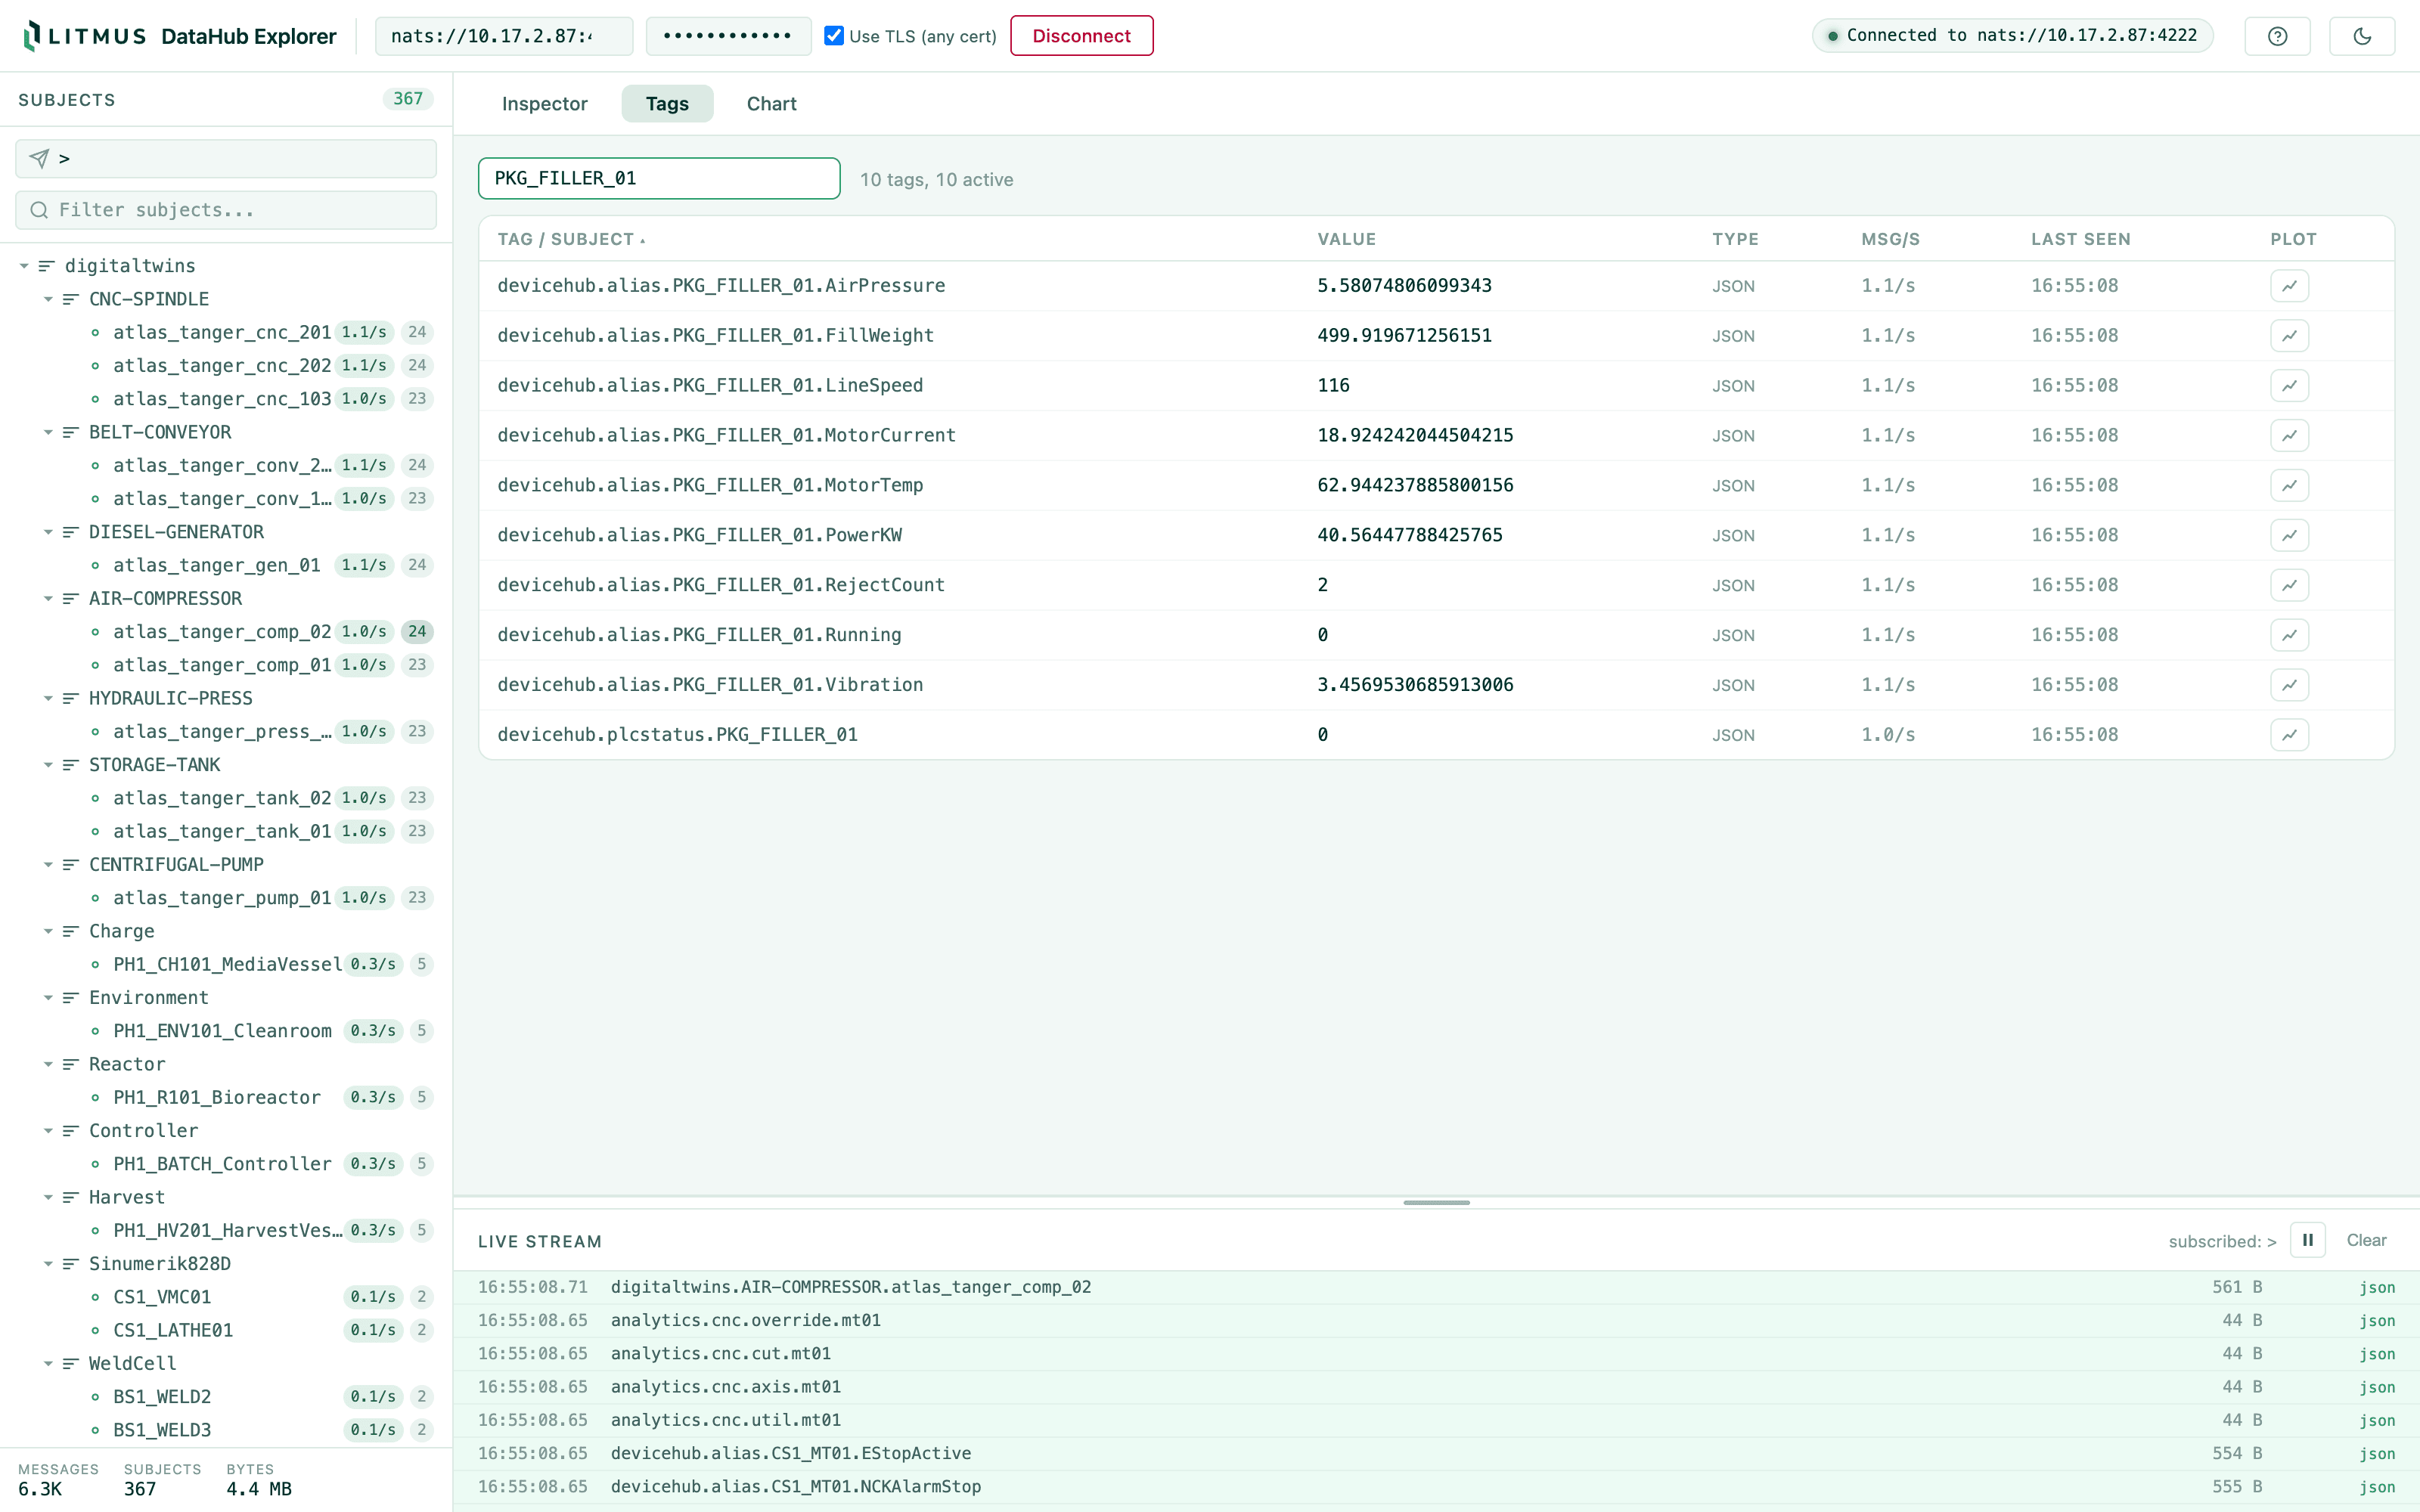
DataHub Explorer tags table with live values from a Litmus Edge device
Live chart of three pinned DeviceHub tags
Payload inspector showing pretty-printed JSON
Per-subject payload history
Subject tree filtered to one device with the publish panel open